Fig. 7
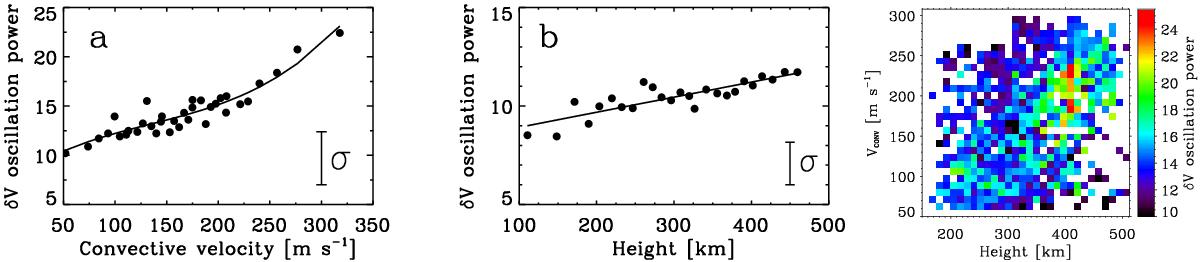
Left panel: power of velocity oscillations in the Ba ii line core as a function of the amplitude of convective motions at the photospheric base. Middle panel: same quantity as a function of height of sign reversal of convective motions. Right panel: bi-dimensional representation of the velocity oscillation power as a function of the strength of convective motions and their reversal height.
Current usage metrics show cumulative count of Article Views (full-text article views including HTML views, PDF and ePub downloads, according to the available data) and Abstracts Views on Vision4Press platform.
Data correspond to usage on the plateform after 2015. The current usage metrics is available 48-96 hours after online publication and is updated daily on week days.
Initial download of the metrics may take a while.