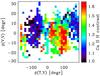
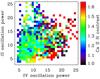
Fig. 5
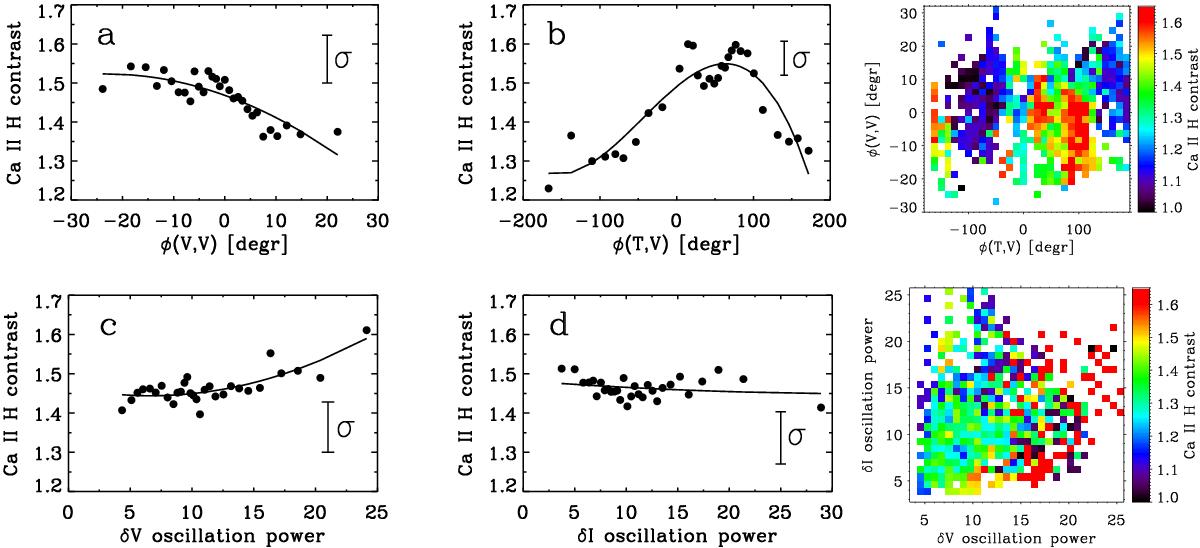
Ca ii H contrast as a function of the parameters of wave motions. Upper left panel: contrast as a function of the phase shift between velocity oscillations at the bottom and upper photosphere for a period with maximum power, φ(V,V). Upper middle panel: contrast as a function of the phase shift between the temperature and velocity oscillations at the base of the photosphere, φ(T,V). Upper right panel: bi-dimensional representation of the Ca ii H contrast as a function of φ(V,V) and φ(T,V). Bottom left panel: contrast as a function of the power of velocity oscillations. Bottom middle panel: contrast as a function of intensity oscillations, in arbitrary units. Bottom right panel: bi-dimensional representation of the Ca ii H contrast as a function of velocity and intensity oscillation power.
Current usage metrics show cumulative count of Article Views (full-text article views including HTML views, PDF and ePub downloads, according to the available data) and Abstracts Views on Vision4Press platform.
Data correspond to usage on the plateform after 2015. The current usage metrics is available 48-96 hours after online publication and is updated daily on week days.
Initial download of the metrics may take a while.