Fig. 3
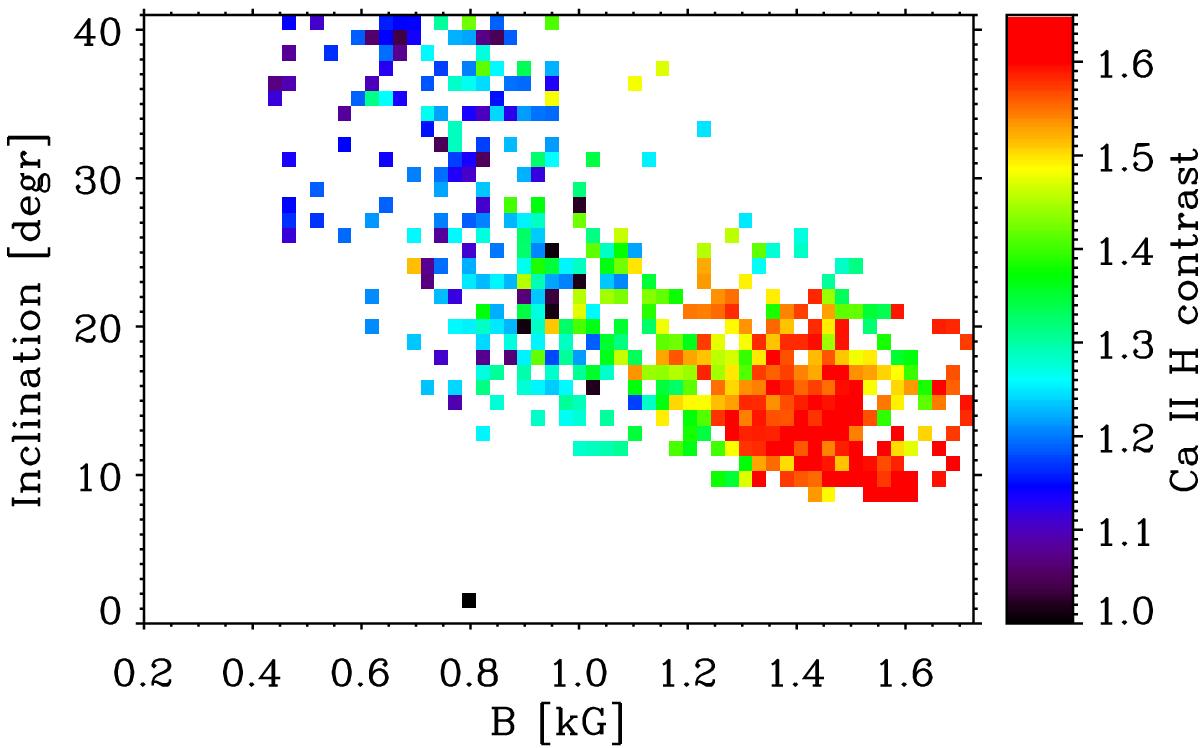
Bi-dimensional representation of the Ca ii H contrast as a function of photospheric magnetic field strength and inclination. Each color rectangle in the scatter plot indicates the mean value of the contrast for a given range of field strengths and inclinations. The white areas are the locations where a particular combination of inclination and field strength is not present in our data.
Current usage metrics show cumulative count of Article Views (full-text article views including HTML views, PDF and ePub downloads, according to the available data) and Abstracts Views on Vision4Press platform.
Data correspond to usage on the plateform after 2015. The current usage metrics is available 48-96 hours after online publication and is updated daily on week days.
Initial download of the metrics may take a while.