Fig. 2
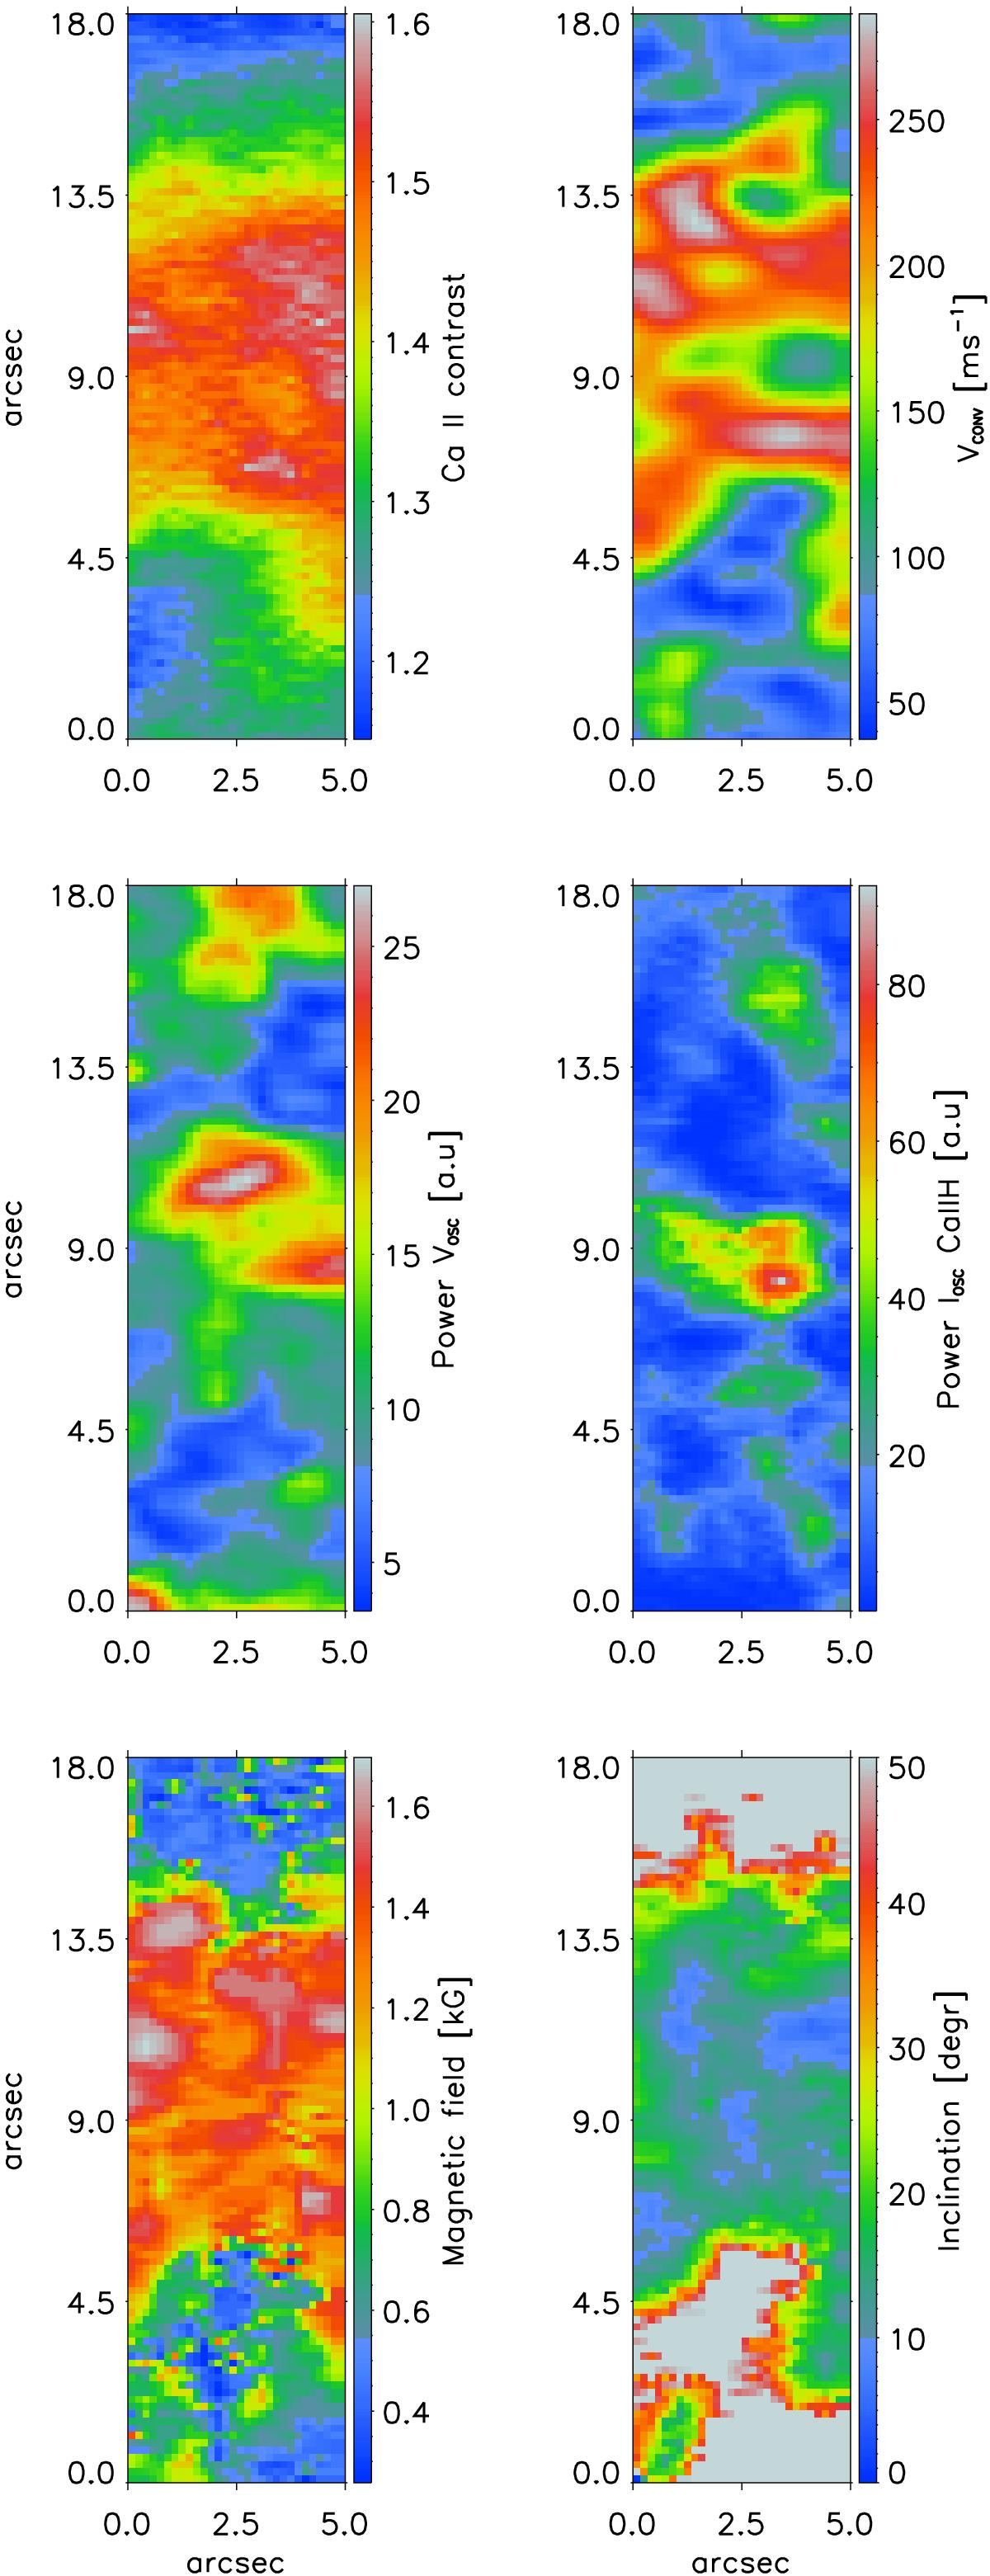
Upper row: maps of Ca ii H contrast (left) and time-average amplitude of the convective velocity at the bottom photosphere (right). Middle row: power of oscillatory velocity component in the upper photosphere (left) and power of oscillatory component of Ca ii H intensity (right). Bottom row: map of the magnetic field strength (left) and inclination with respect to the normal to the surface (right) in the observed field of view obtained after inversions of Fe i lines.
Current usage metrics show cumulative count of Article Views (full-text article views including HTML views, PDF and ePub downloads, according to the available data) and Abstracts Views on Vision4Press platform.
Data correspond to usage on the plateform after 2015. The current usage metrics is available 48-96 hours after online publication and is updated daily on week days.
Initial download of the metrics may take a while.