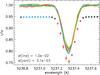
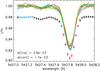
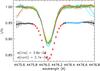
Fig. 4

Cr ii 5237 Å (left) and Fe ii 5427 Å (middle) lines of the primary, and Fe i 4476 Å (right) line of the secondary, for the 19 observations described in the text (Sect. 3.3.1, overplotted coloured lines). The mean (diamonds) and standard deviations (vertical bars) of each pixel inside and around the line have been overplotted and shifted by −0.05 in the y direction for the left and right panels, and by −0.02 for the middle panel. Red diamonds represent the pixels inside the spectral line, while blue diamonds represent the pixels in the local continuum. The averages of the standard deviations inside the line (σ(line)) and in the continuum (σ(cont)) are indicated in the bottom left corners.
Current usage metrics show cumulative count of Article Views (full-text article views including HTML views, PDF and ePub downloads, according to the available data) and Abstracts Views on Vision4Press platform.
Data correspond to usage on the plateform after 2015. The current usage metrics is available 48-96 hours after online publication and is updated daily on week days.
Initial download of the metrics may take a while.