Fig. 3
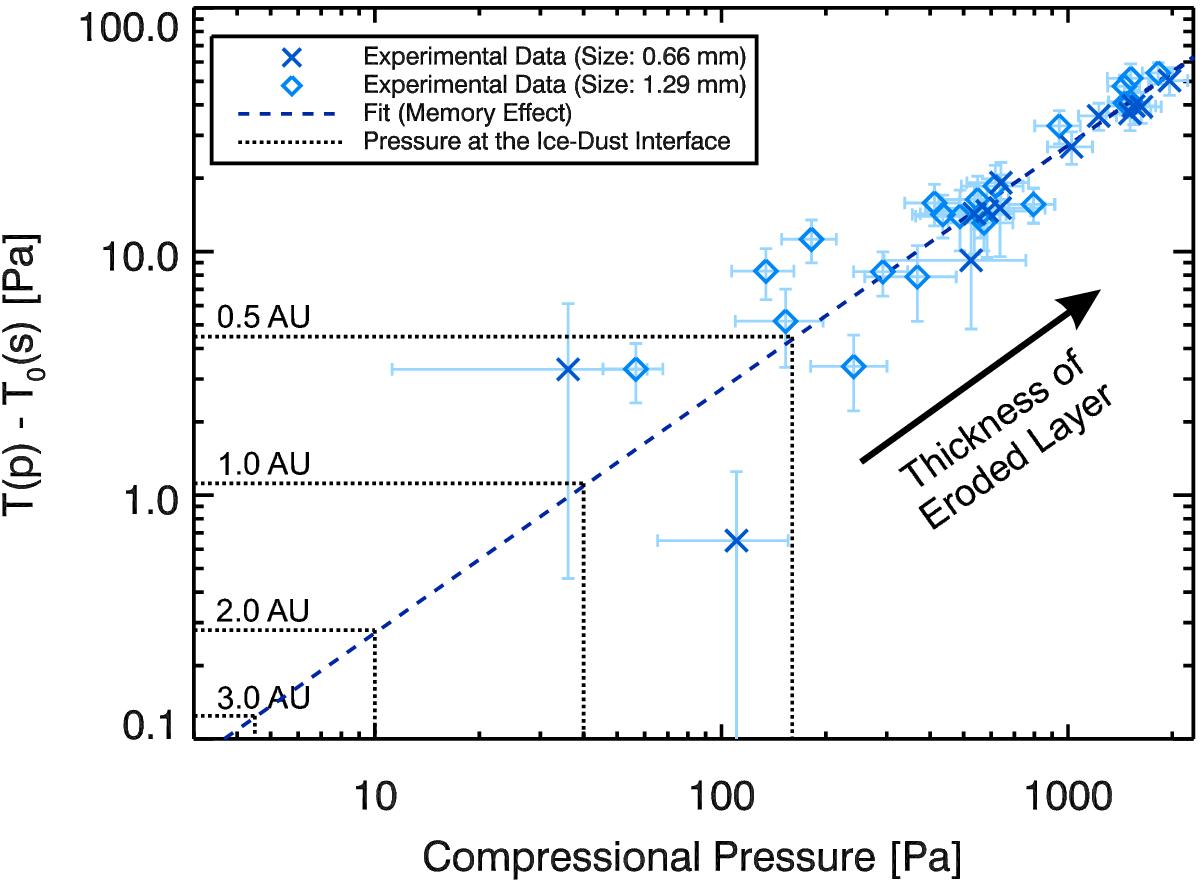
Tensile strength acquired through the memory effect, T(p) − T0(s), as a function of the compression p experienced by dust-aggregate layers, as measured by Blum et al. (2014). The blue crosses and diamonds represent dust-aggregate radii of (0.66 ± 0.14) mm and (1.29 ± 0.29) mm, respectively. A linear fit to the data (blue dashed line) visualises the memory effect. For comparison, the dotted horizontal lines show the typical CO gas pressure at the ice-dust interface, i.e., the boundary between the covering non-volatile material and the ices, of a cometary nucleus derived for different heliocentric distances by using the model developed by Gundlach et al. (2015). If the gas pressure at the ice-dust interface exceeds the tensile strength of the dust-aggregate layer, gas-driven dust activity is possible.
Current usage metrics show cumulative count of Article Views (full-text article views including HTML views, PDF and ePub downloads, according to the available data) and Abstracts Views on Vision4Press platform.
Data correspond to usage on the plateform after 2015. The current usage metrics is available 48-96 hours after online publication and is updated daily on week days.
Initial download of the metrics may take a while.