Fig. 9
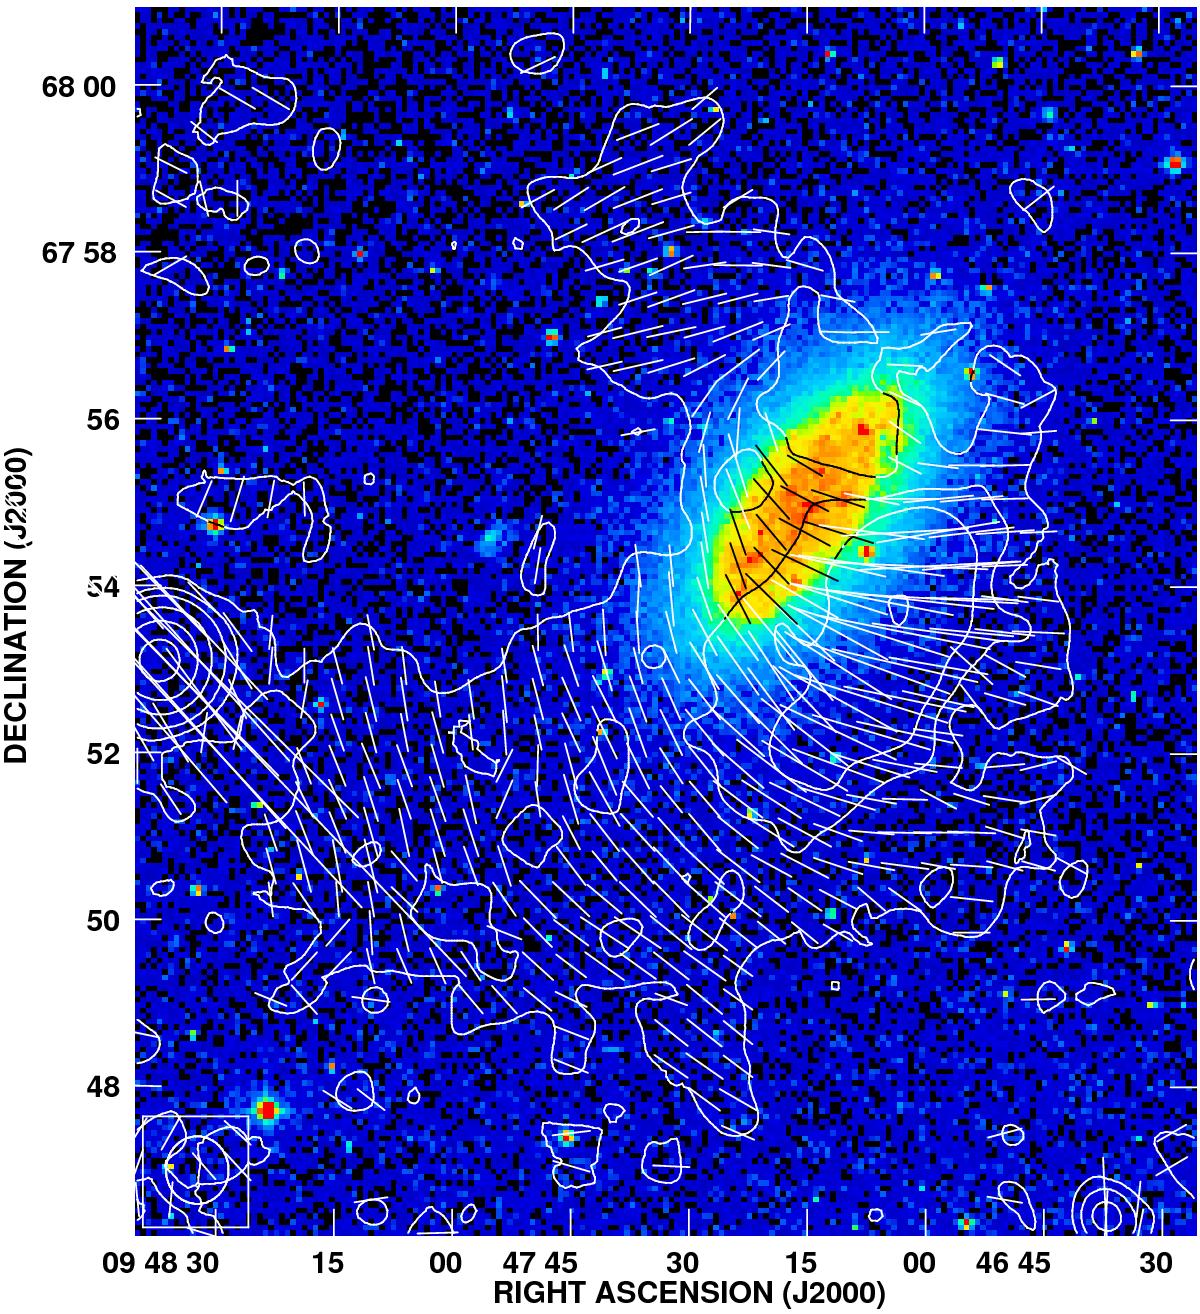
Contours and apparent B-vectors (not corrected for Faraday rotation) of polarized intensity of NGC 2976 from the WSRT-SINGS data superimposed on the DSS blue image. The contour levels are (3, 5, 8, 16, 32, 64) × 25 (rms noise level) μJy/beam. The vector of 10′′ length corresponds to the polarized intensity of about 31.3 μJy/beam. The map resolution is 48.6′′× 45.0′′ HPBW.
Current usage metrics show cumulative count of Article Views (full-text article views including HTML views, PDF and ePub downloads, according to the available data) and Abstracts Views on Vision4Press platform.
Data correspond to usage on the plateform after 2015. The current usage metrics is available 48-96 hours after online publication and is updated daily on week days.
Initial download of the metrics may take a while.