Free Access
Fig. 7
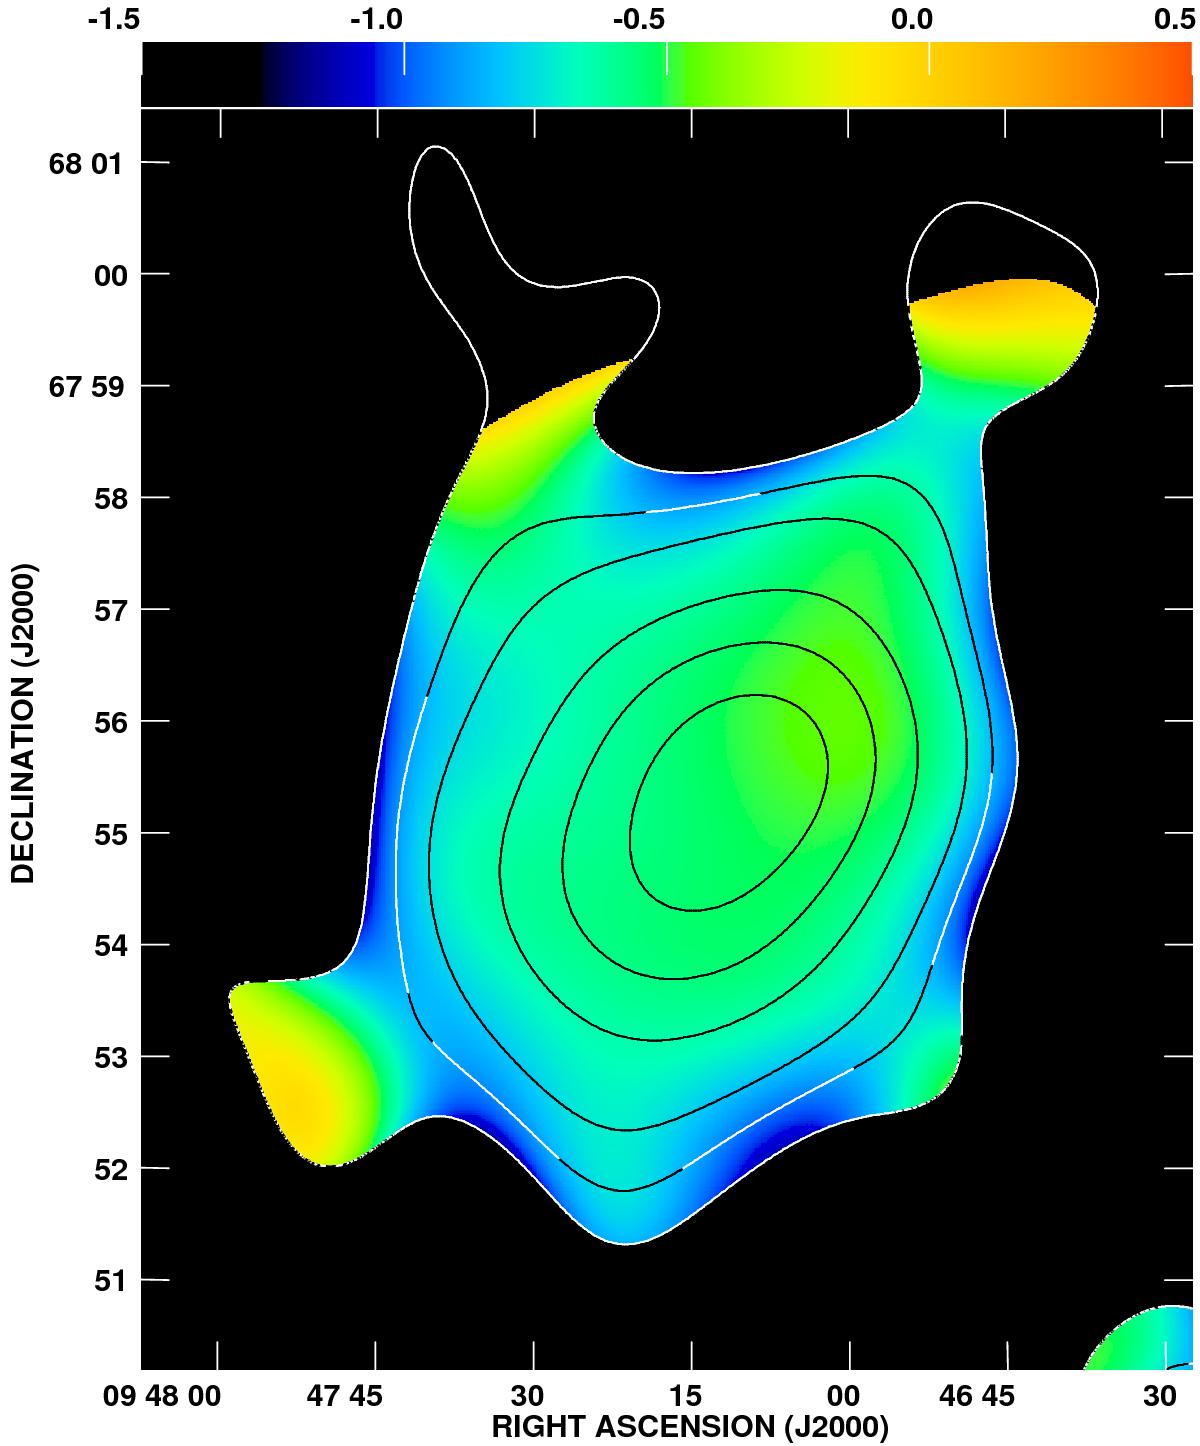
Radio spectral index distribution between 4.85 and 1.43 GHz in NGC 2976 (colours). Both maps of total intensity were convolved to a common beam of 152′′ (the beam is not shown). The contours represent the total power map at 4.85 GHz, their levels are: (−5, −3, 3, 5, 8, 16, 24, 32) × 450 (rms noise level) μJy/beam.
Current usage metrics show cumulative count of Article Views (full-text article views including HTML views, PDF and ePub downloads, according to the available data) and Abstracts Views on Vision4Press platform.
Data correspond to usage on the plateform after 2015. The current usage metrics is available 48-96 hours after online publication and is updated daily on week days.
Initial download of the metrics may take a while.