Fig. 10
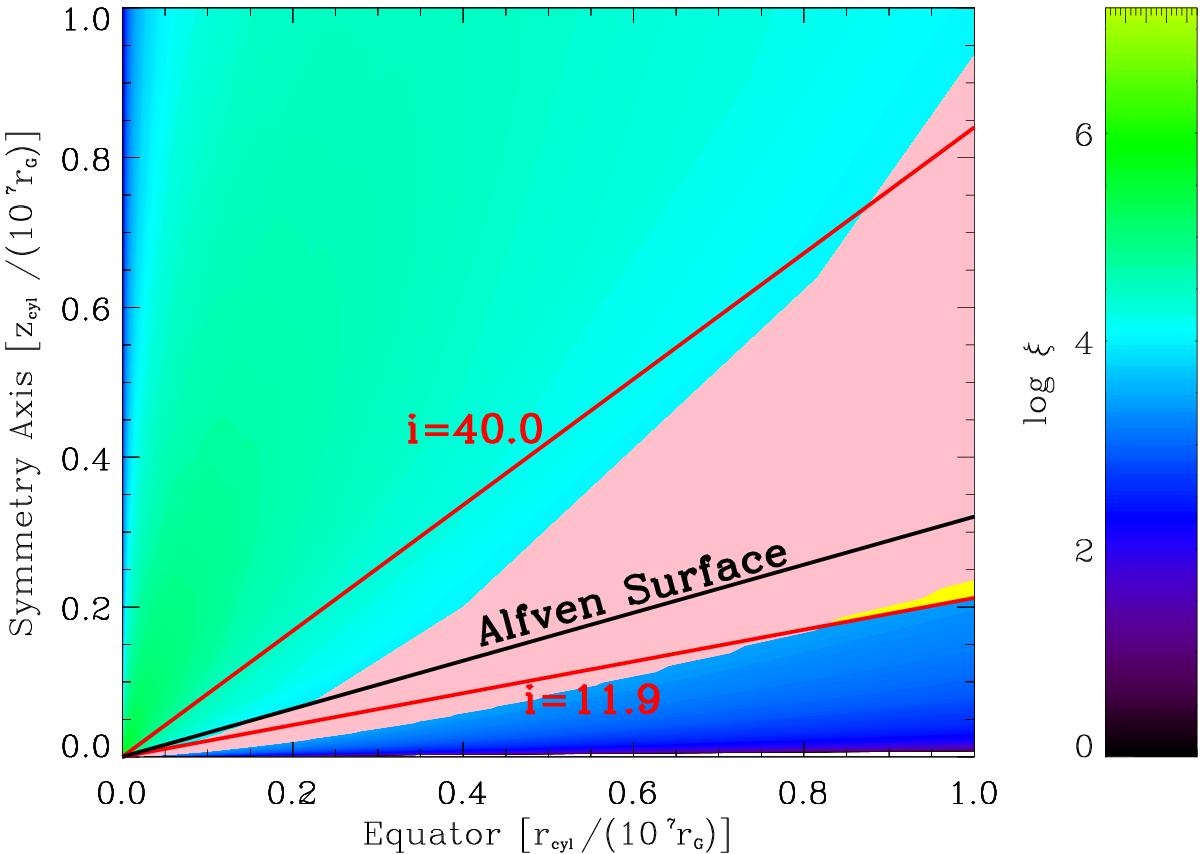
Wind characteristics when the Best Warm Solution is illuminated with a Hard SED. The drastically reduced yellow region within the outflow (cf. Fig. 7) is obtained in the same way as in Figs. 5 and 7. We can only see a very small portion of this yellow region at rcyl/ (107rg) > 0.8. The rest of this yellow region is occulted by the pink wedge, which represents the thermodynamically unstable part of the outflow that has 3.4 ≤ log ξ ≤ 4.05. We note that a small part of this unstable outflow is within the Compton thick region with log NH> 24 (portions below the line marking the low angle i = 11.9°).
Current usage metrics show cumulative count of Article Views (full-text article views including HTML views, PDF and ePub downloads, according to the available data) and Abstracts Views on Vision4Press platform.
Data correspond to usage on the plateform after 2015. The current usage metrics is available 48-96 hours after online publication and is updated daily on week days.
Initial download of the metrics may take a while.