Fig. 5
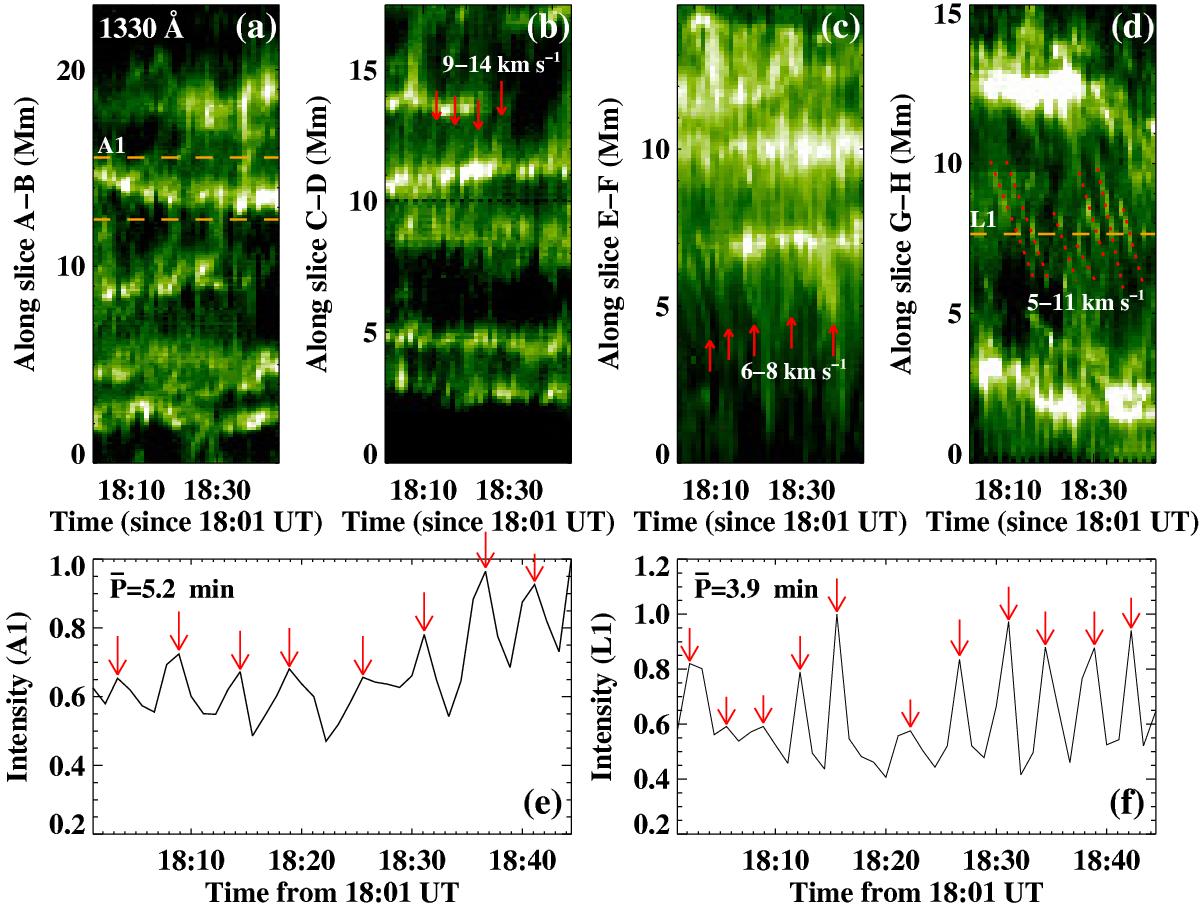
Panels a)–d): stack plots along slices “A−B” and “C−D” (dashed lines in Fig. 2b) and slices “E−F” and “G−H” (dashed lines in Fig. 4b). Red arrows and dotted lines show the repeated upflows. Panel e): intensity variation of a BP in panel a) at 1330 Å. Each data point of the profile is the vertical sum of the intensity in area “A1” (two dashed lines in panel a)). Red arrows point to the peaks of the quasi-periodic intensity profile. Panel f): horizontal slice (black curve) along the dashed line (“L1”) in panel d) at 1330 Å.
Current usage metrics show cumulative count of Article Views (full-text article views including HTML views, PDF and ePub downloads, according to the available data) and Abstracts Views on Vision4Press platform.
Data correspond to usage on the plateform after 2015. The current usage metrics is available 48-96 hours after online publication and is updated daily on week days.
Initial download of the metrics may take a while.