Fig. 2
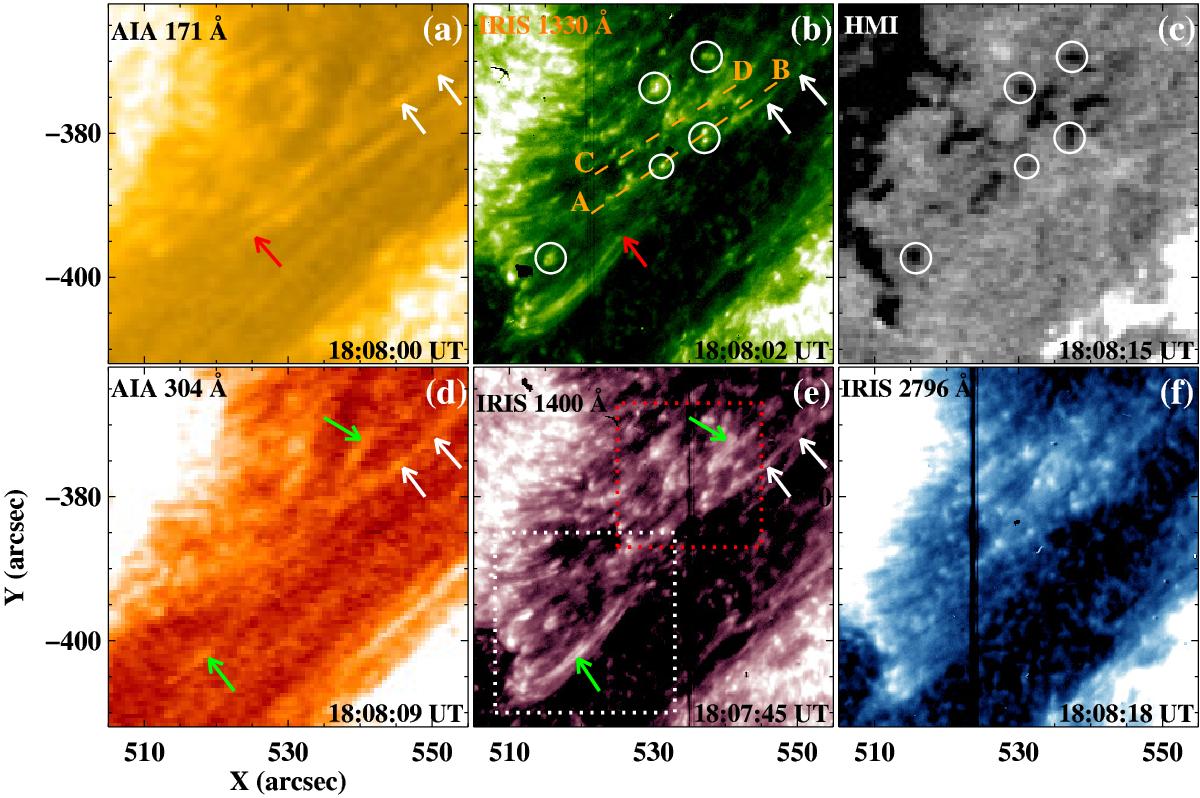
Appearance of BPs and loop-like structures in region “R1”. The white circles outline the locations of several BPs in the 1330 Å image and HMI LOS magnetogram. The arrows in panels a), b) and d), e) point to the loop-like structures in close proximity to some BPs. Dashed lines “A−B” and “C−D” (panel b)) show the cut positions used to obtain the stack plots shown in Figs. 5a, b. Red and white squares in panel e) denote the FOVs of Figs. 3a–d and e–l, respectively.
Current usage metrics show cumulative count of Article Views (full-text article views including HTML views, PDF and ePub downloads, according to the available data) and Abstracts Views on Vision4Press platform.
Data correspond to usage on the plateform after 2015. The current usage metrics is available 48-96 hours after online publication and is updated daily on week days.
Initial download of the metrics may take a while.