Fig. A.1
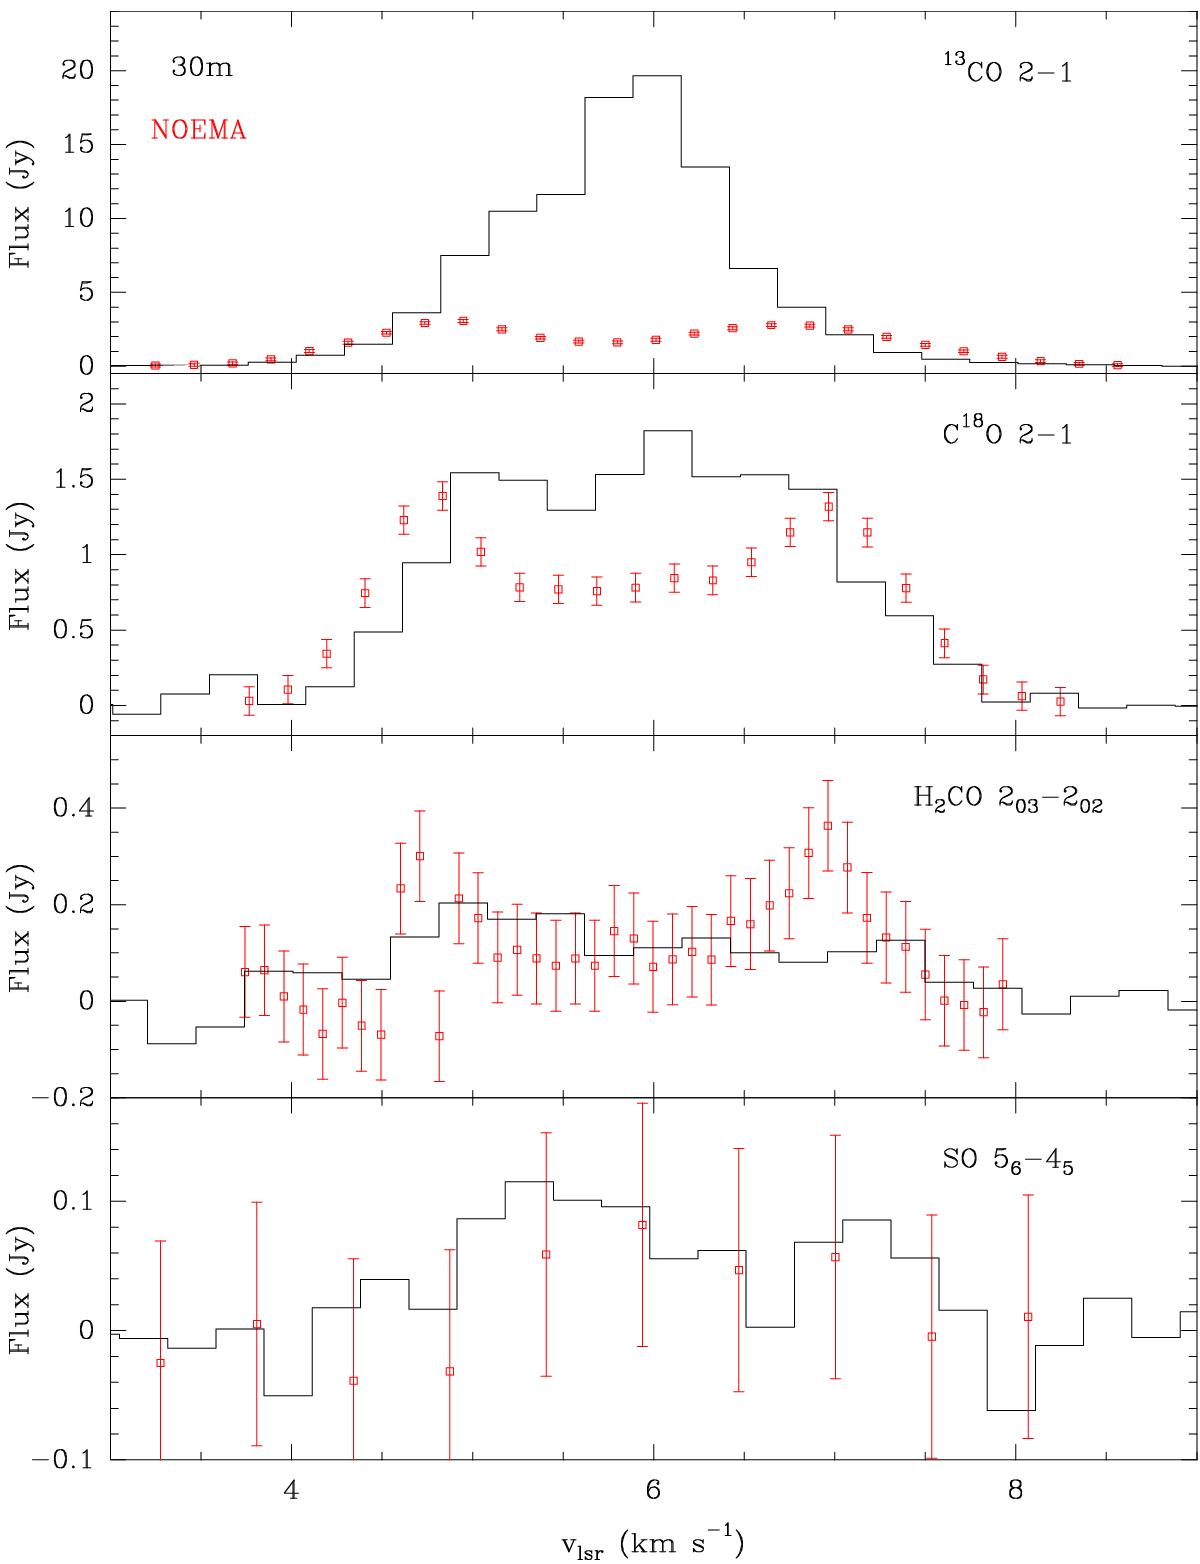
Comparison between the single-dish IRAM 30 m spectra (black histogram) published by Pacheco-Vázquez et al. (2015) and NOEMA interferometric spectra (red points). We note that the 30 m observations were performed using the wobbler switching procedure and the cloud emission is subtracted with the OFF position. The absence of missing flux does not imply the absence of an extended component.
Current usage metrics show cumulative count of Article Views (full-text article views including HTML views, PDF and ePub downloads, according to the available data) and Abstracts Views on Vision4Press platform.
Data correspond to usage on the plateform after 2015. The current usage metrics is available 48-96 hours after online publication and is updated daily on week days.
Initial download of the metrics may take a while.