Fig. 6
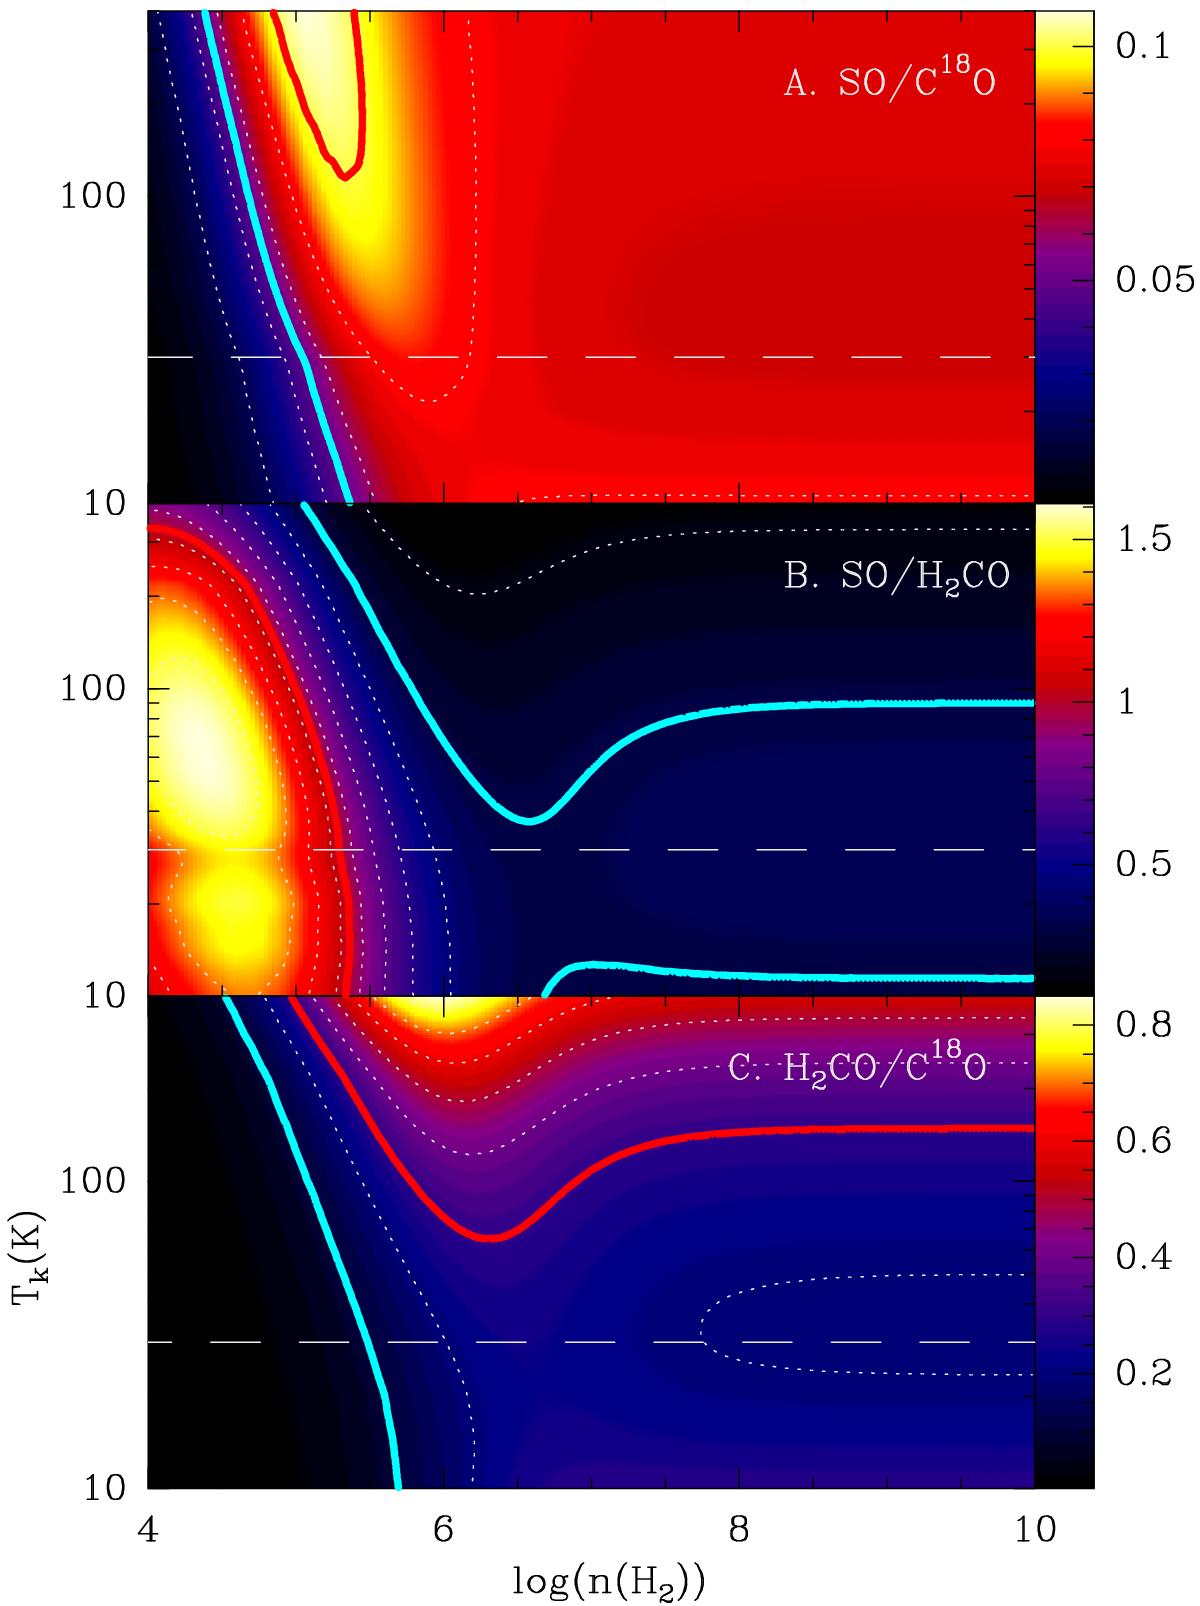
LVG calculations. We assumed N(SO) = 2 × 1013 cm-2, N(H2CO) = 1 × 1013 cm-2, and N(C18O) = 2 × 1016 cm-2. From top to bottom, we plot the I(SO J = 56 → 45)/I(C18O J = 2 → 1), I(SO J = 56 → 45)/I(H2CO J = 30,3 → 20,2), and I(H2CO J = 303 → 202)/I(C18O J = 2 → 1) line intensity ratios. The long-dashed line corresponds to a gas kinetic temperature of Tk = 30 K, which is the midplane temperature derived by Piétu et al. (2005) and Pacheco-Vázquez et al. (2015). Solid lines indicate the values derived from our maps (Fig. 5). The red and blue lines trace the maximum and minimum observed ratios, respectively.
Current usage metrics show cumulative count of Article Views (full-text article views including HTML views, PDF and ePub downloads, according to the available data) and Abstracts Views on Vision4Press platform.
Data correspond to usage on the plateform after 2015. The current usage metrics is available 48-96 hours after online publication and is updated daily on week days.
Initial download of the metrics may take a while.