Fig. 5
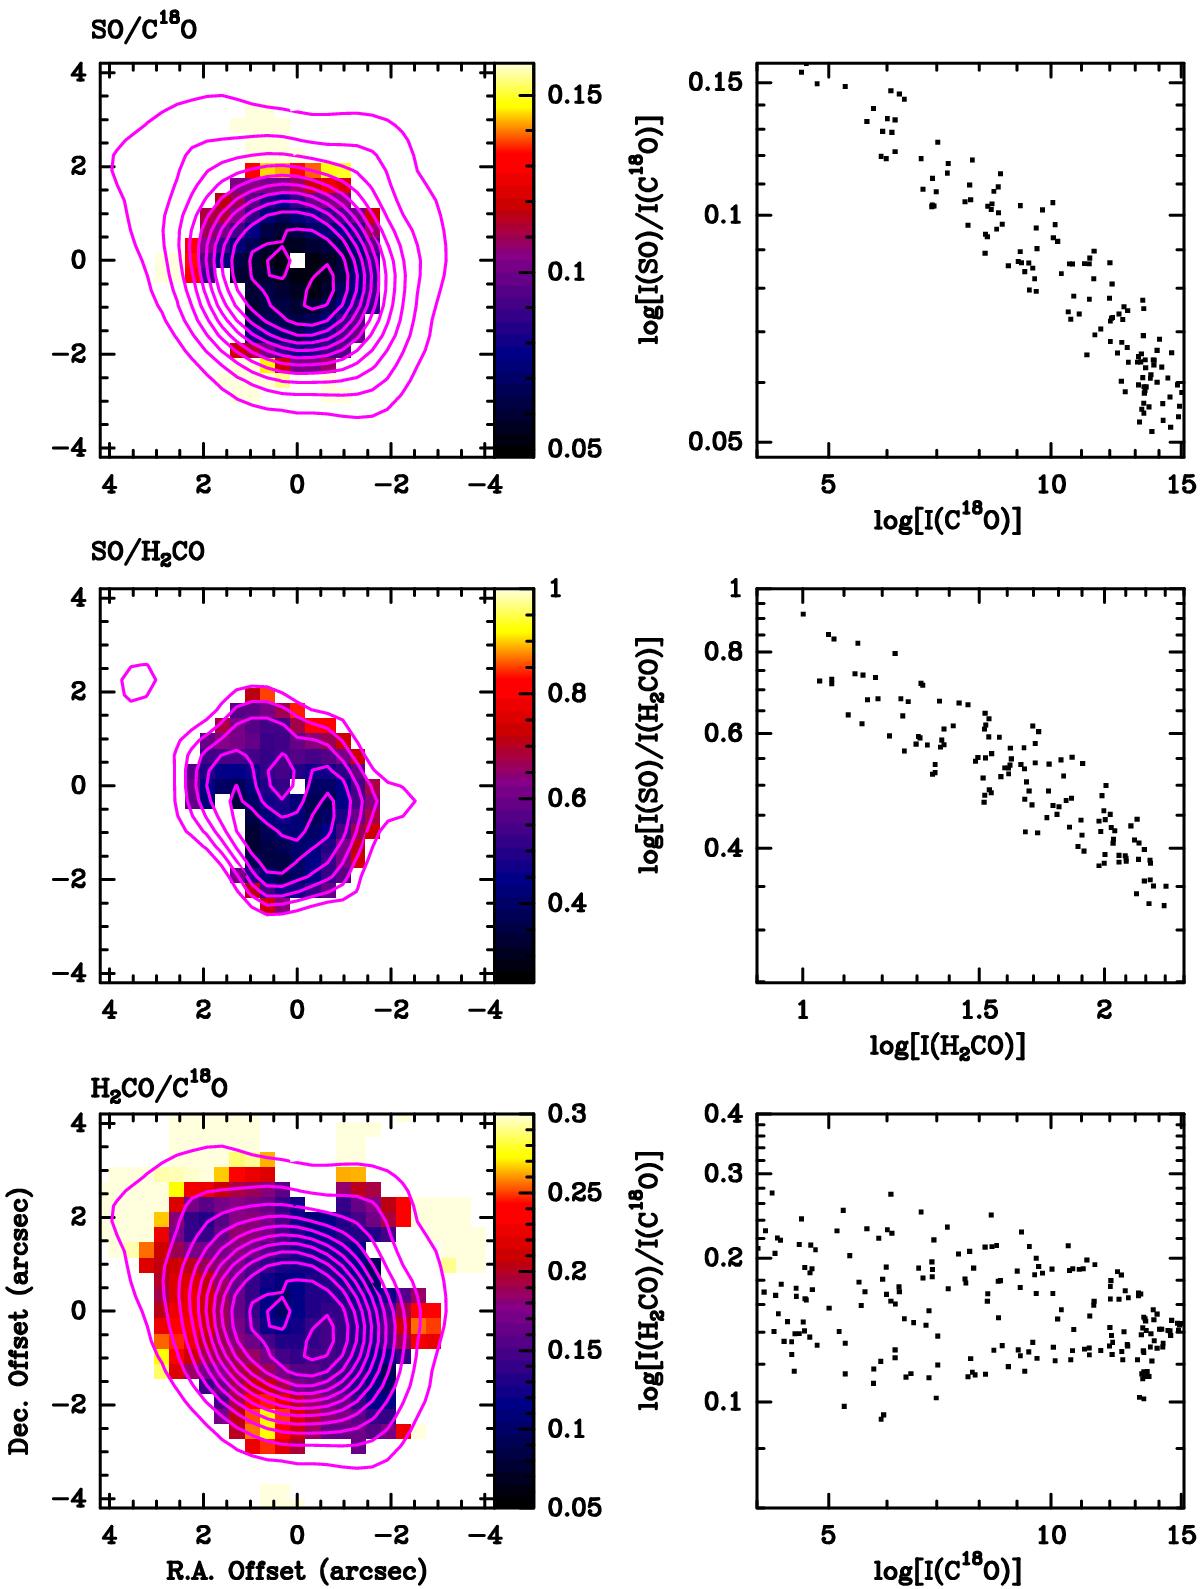
Line integrated intensity ratios. The color maps correspond to I(SO J = 56 → 45)/I(C18O J = 2 → 1), I(SO J = 56 → 45)/I(H2CO J = 30,3 → 20,2), and I(H2CO J = 303 → 202)/I(C18O J = 2 → 1) in temperature units. While the I(H2CO)/I(C18O) ratio is fairly constant in the disk, the I(SO)/I(C18O) and I(SO)/I(H2CO) present a clear NE-SW gradient with its minimum value toward the dust trap. Although there is a large dispersion, there appears to be an anticorrelation with C18O intensity, which is a measure of column density, which in turn is thought to correlate (assuming a disk-like or ring morphology) with the local density.
Current usage metrics show cumulative count of Article Views (full-text article views including HTML views, PDF and ePub downloads, according to the available data) and Abstracts Views on Vision4Press platform.
Data correspond to usage on the plateform after 2015. The current usage metrics is available 48-96 hours after online publication and is updated daily on week days.
Initial download of the metrics may take a while.