Fig. 4
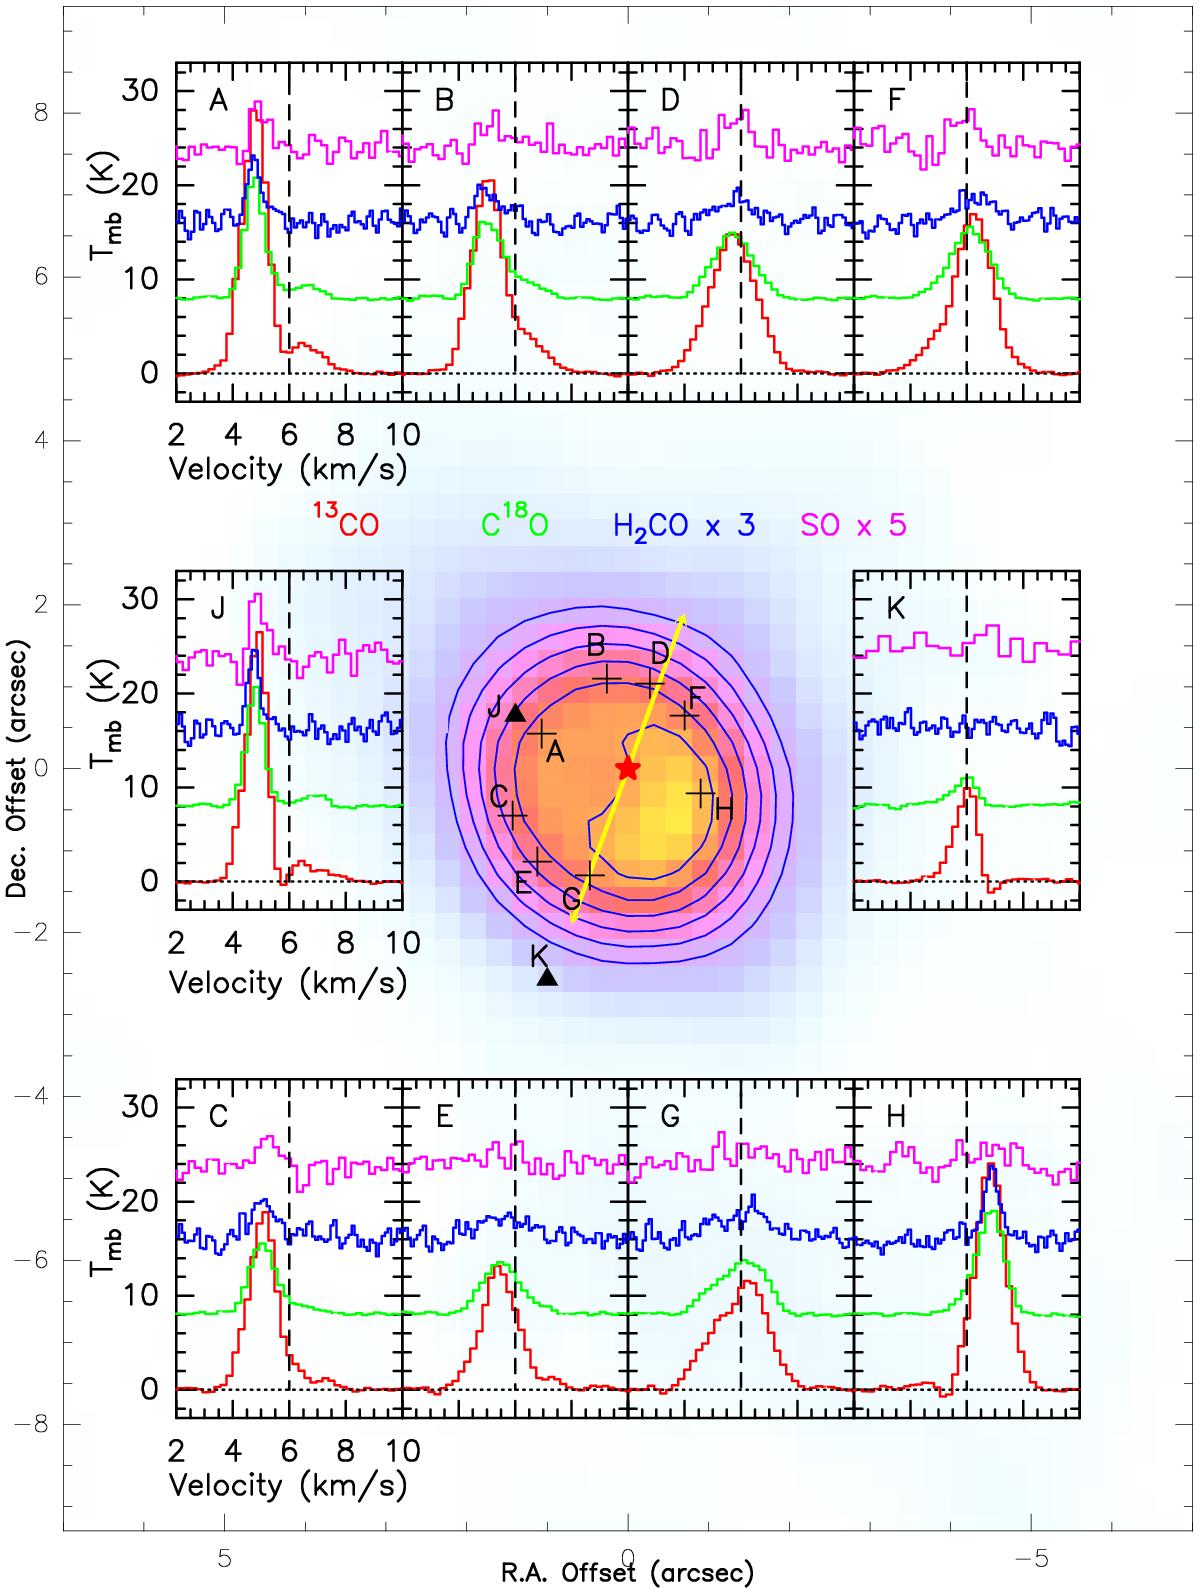
Spectra of detected molecules over ten points around the AB Aur disk. In color gradient, the C18O J = 2 → 1 integrated intensity map from Fig. 1. Contour levels are from 40% to 90% in steps of 10% the maximum (15 K × km s-1). The position of the central source is marked by a red star. The arrow indicates the direction of the ionized jet (Rodríguez et al. 2014). The ten boxes labeled from A to K show the spectra of the 13CO J = 2 → 1, C18O J = 2 → 1, SO J = 56 → 45, and H2CO J = 30,3 → 20,2 lines toward selected positions. We note that the SO emission is extremely weak (even undetected) toward the southwest.
Current usage metrics show cumulative count of Article Views (full-text article views including HTML views, PDF and ePub downloads, according to the available data) and Abstracts Views on Vision4Press platform.
Data correspond to usage on the plateform after 2015. The current usage metrics is available 48-96 hours after online publication and is updated daily on week days.
Initial download of the metrics may take a while.