Free Access
Fig. 2
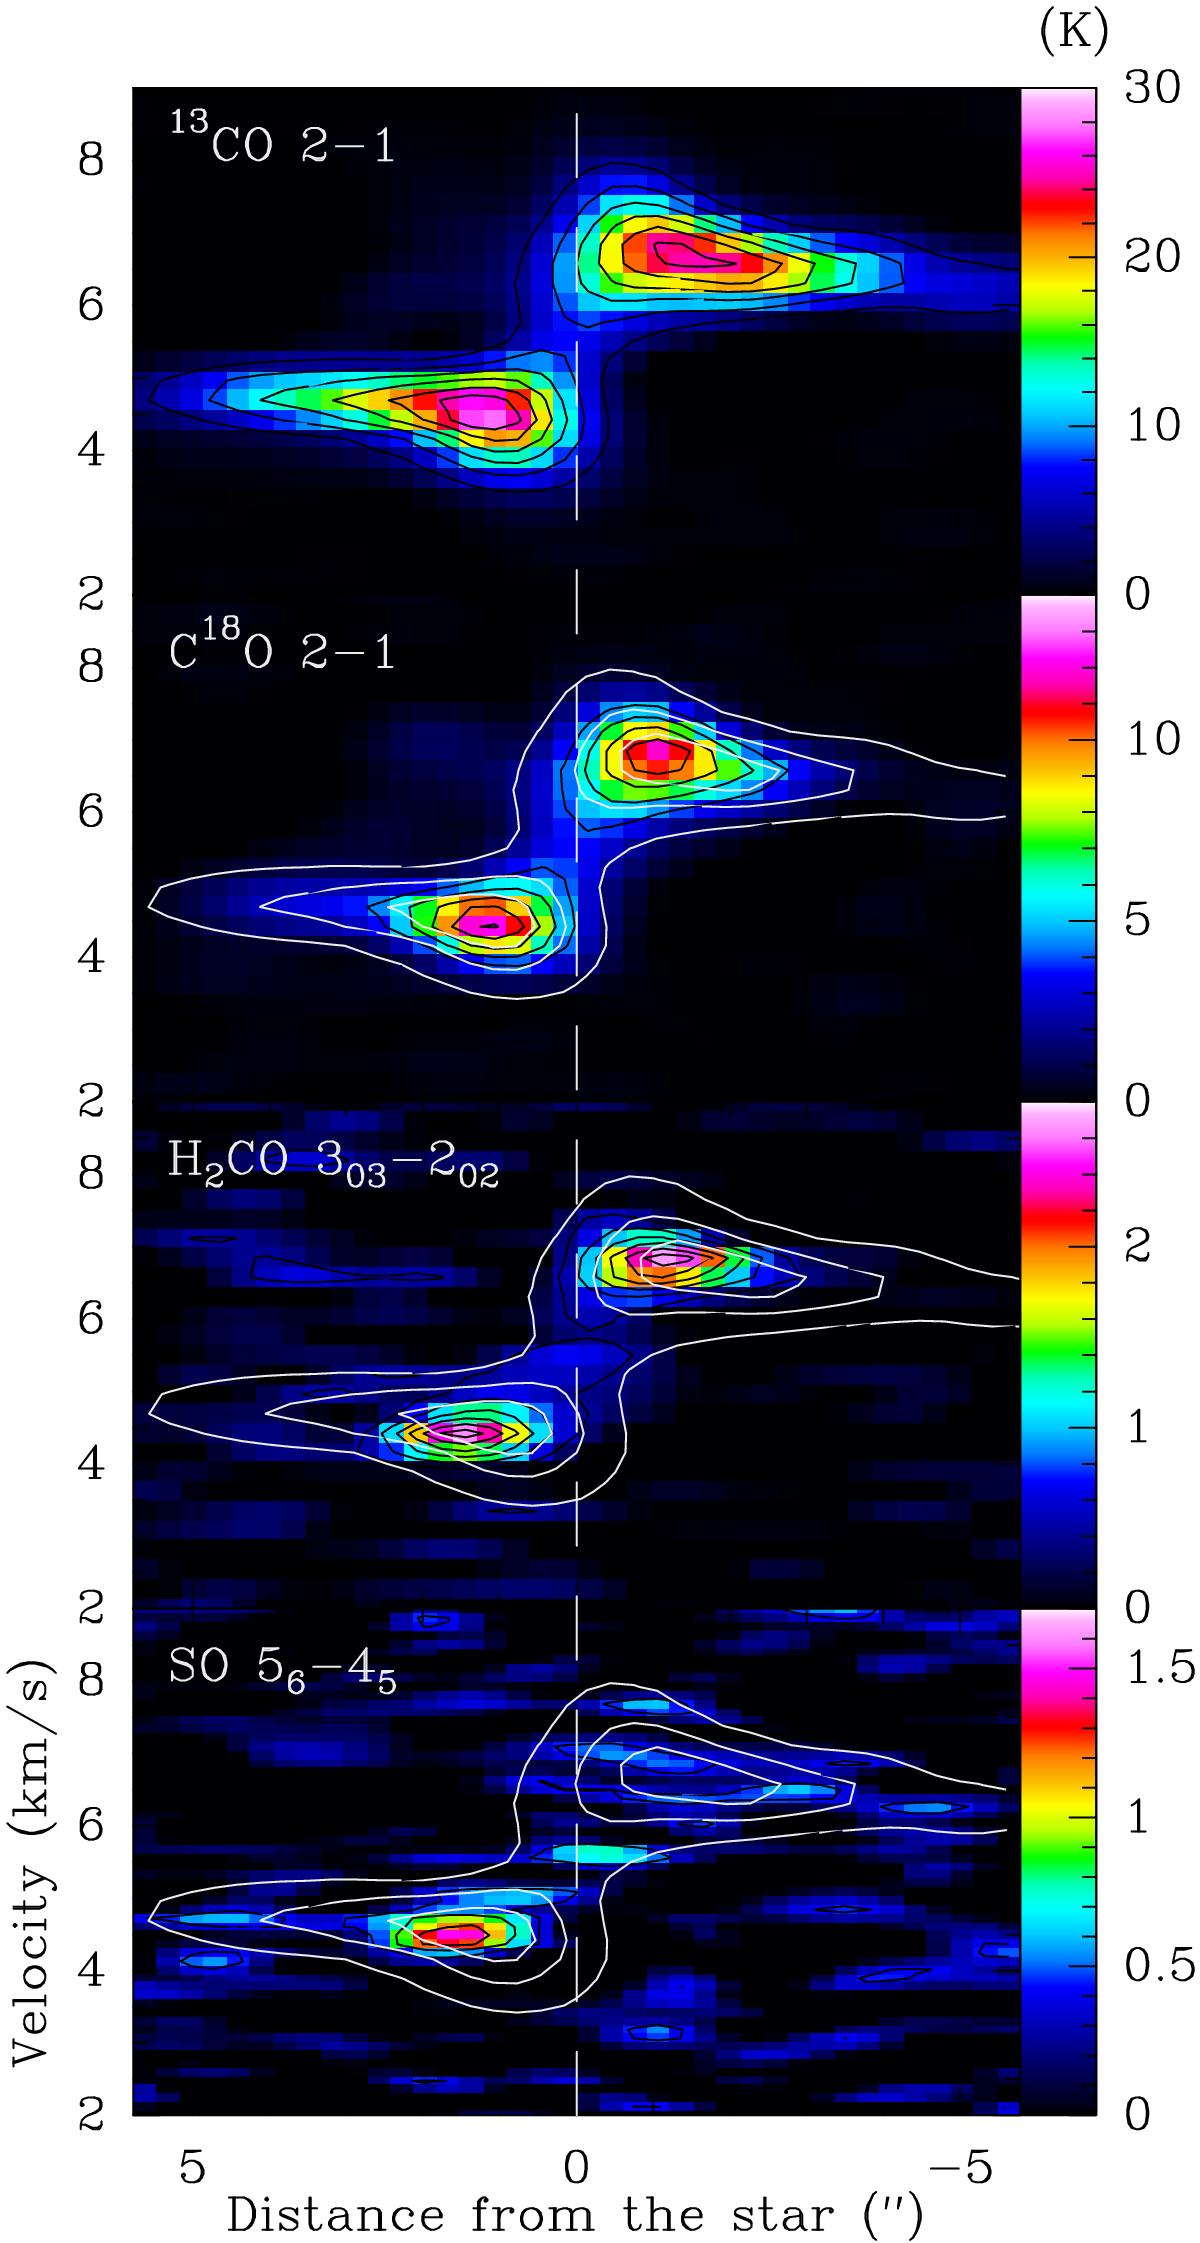
Position-velocity diagrams along the major axis of the disk, from the NE to the SW as defined in Piétu et al. (2005). For comparison, we have overlaid the contours of the 13CO J = 2 → 1 line in all panels. We note that there is an important asymmetry in the SO emission with very weak emission in the southwestern half.
Current usage metrics show cumulative count of Article Views (full-text article views including HTML views, PDF and ePub downloads, according to the available data) and Abstracts Views on Vision4Press platform.
Data correspond to usage on the plateform after 2015. The current usage metrics is available 48-96 hours after online publication and is updated daily on week days.
Initial download of the metrics may take a while.