Fig. 1
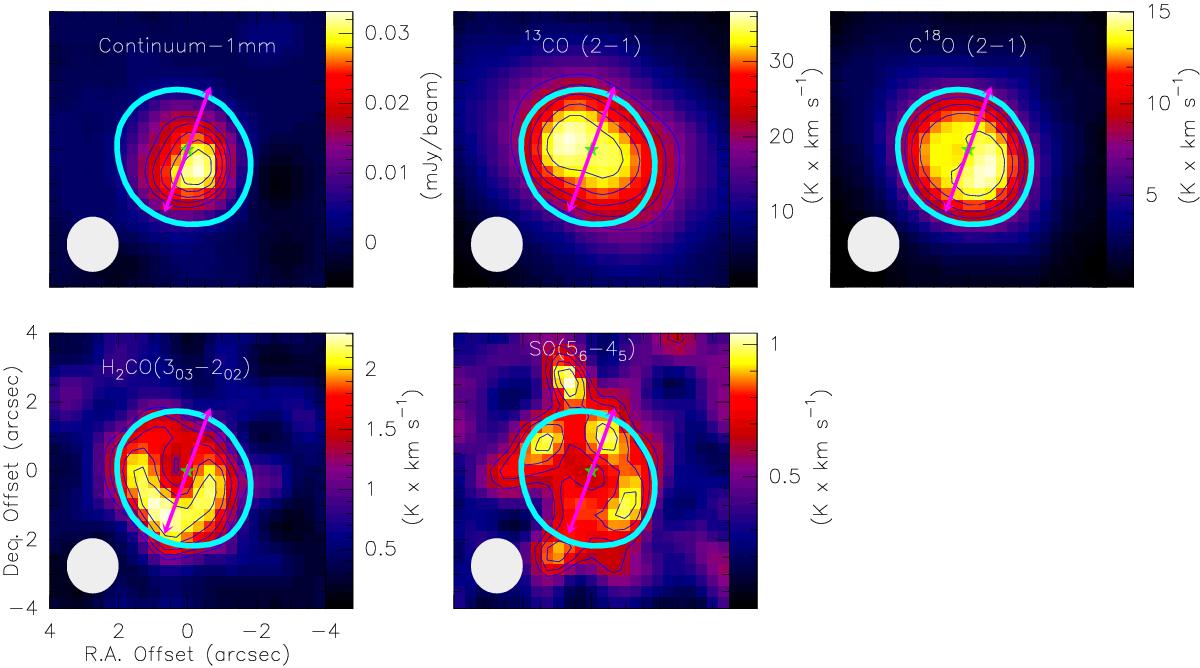
NOEMA images of the circumstellar disk around AB Aur. The 1 mm continuum dust emission map, and the velocity-integrated intensity images from 3.5 to 8 km s-1 of the 13CO J = 2 → 1, C18O J = 2 → 1, SO J = 56 → 45, and H2CO J = 303 → 202 lines. White ellipses in the bottom left corner of each panel represents the beam size (~1.̋6 ×1.̋5). Contour levels are 50% to 90% in steps 10% of the maximum value (34 mJy beam-1 for the continuum, 37 K × km s-1 for the 13CO J = 2 → 0, 15 K × km s-1 for the C18O J = 2 → 0, 2.3 K × km s-1 for the H2CO J = 30,3 → 20,2, and 1.0 K × km s-1 for the SO). The thick blue contour indicates the 50% level of the C18O emission. The arrow shows the direction of the ionized jet (Rodríguez et al. 2014).
Current usage metrics show cumulative count of Article Views (full-text article views including HTML views, PDF and ePub downloads, according to the available data) and Abstracts Views on Vision4Press platform.
Data correspond to usage on the plateform after 2015. The current usage metrics is available 48-96 hours after online publication and is updated daily on week days.
Initial download of the metrics may take a while.