Free Access
Fig. 2
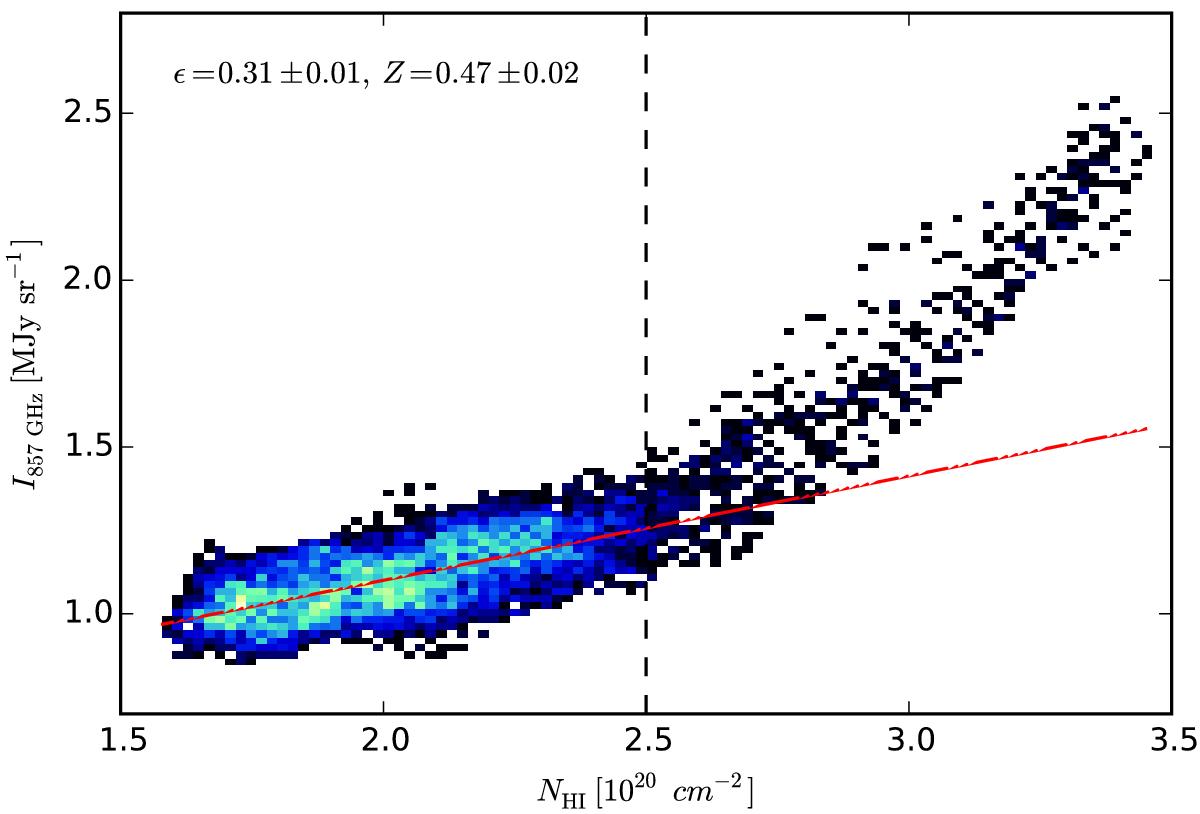
NHI versus IFIR 857 GHz correlation plot. The solid line represents a linear approximation (see Eq. (3)) to the data. Above NHI = 2.5 × 1020 cm-2 FIR excess emission is observed. This emission is attributed to the presence of additional molecular hydrogen regions not traced by NHI.
Current usage metrics show cumulative count of Article Views (full-text article views including HTML views, PDF and ePub downloads, according to the available data) and Abstracts Views on Vision4Press platform.
Data correspond to usage on the plateform after 2015. The current usage metrics is available 48-96 hours after online publication and is updated daily on week days.
Initial download of the metrics may take a while.