Fig. 1
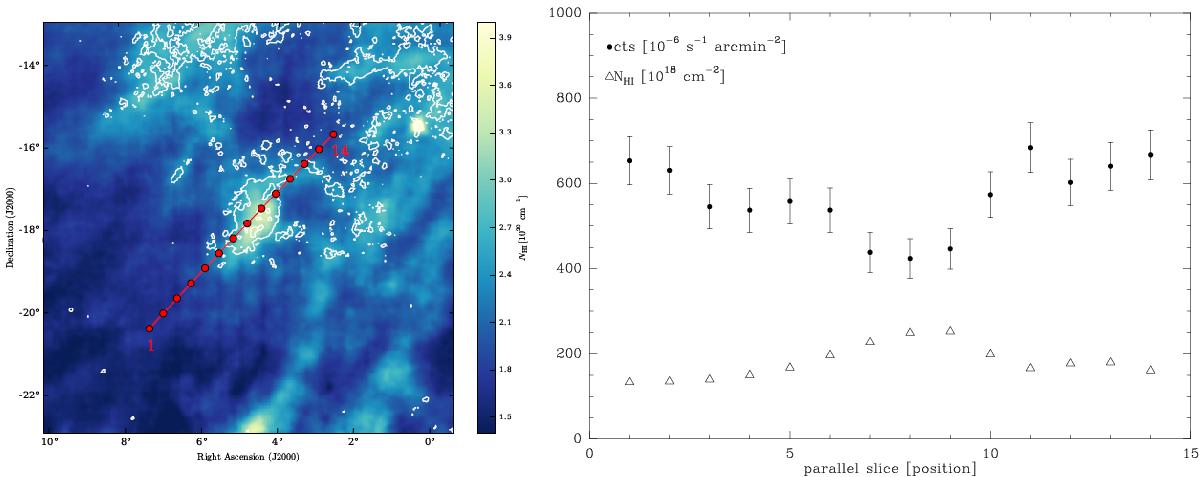
Left: integrated (−37.3 ≤ vLSR [ km s-1 ] ≤ 52.9) GASS HI column density map of HRK 81.4–77.8. Superposed as contours is the Planck 857 GHz intensity distribution starting at 0.76 MJy sr-1 in steps of 0.45 MJy sr-1. Right: slice across the longest extent of HRK 81.4–77.8 (see left panel, dots along the solid line). The open triangles mark the HI column density distribution NHI in 1018 cm-2, the filled circles represent the ROSAT R12 count rate in 10-6 cts s-1 arcmin-2.
Current usage metrics show cumulative count of Article Views (full-text article views including HTML views, PDF and ePub downloads, according to the available data) and Abstracts Views on Vision4Press platform.
Data correspond to usage on the plateform after 2015. The current usage metrics is available 48-96 hours after online publication and is updated daily on week days.
Initial download of the metrics may take a while.