Fig. 6
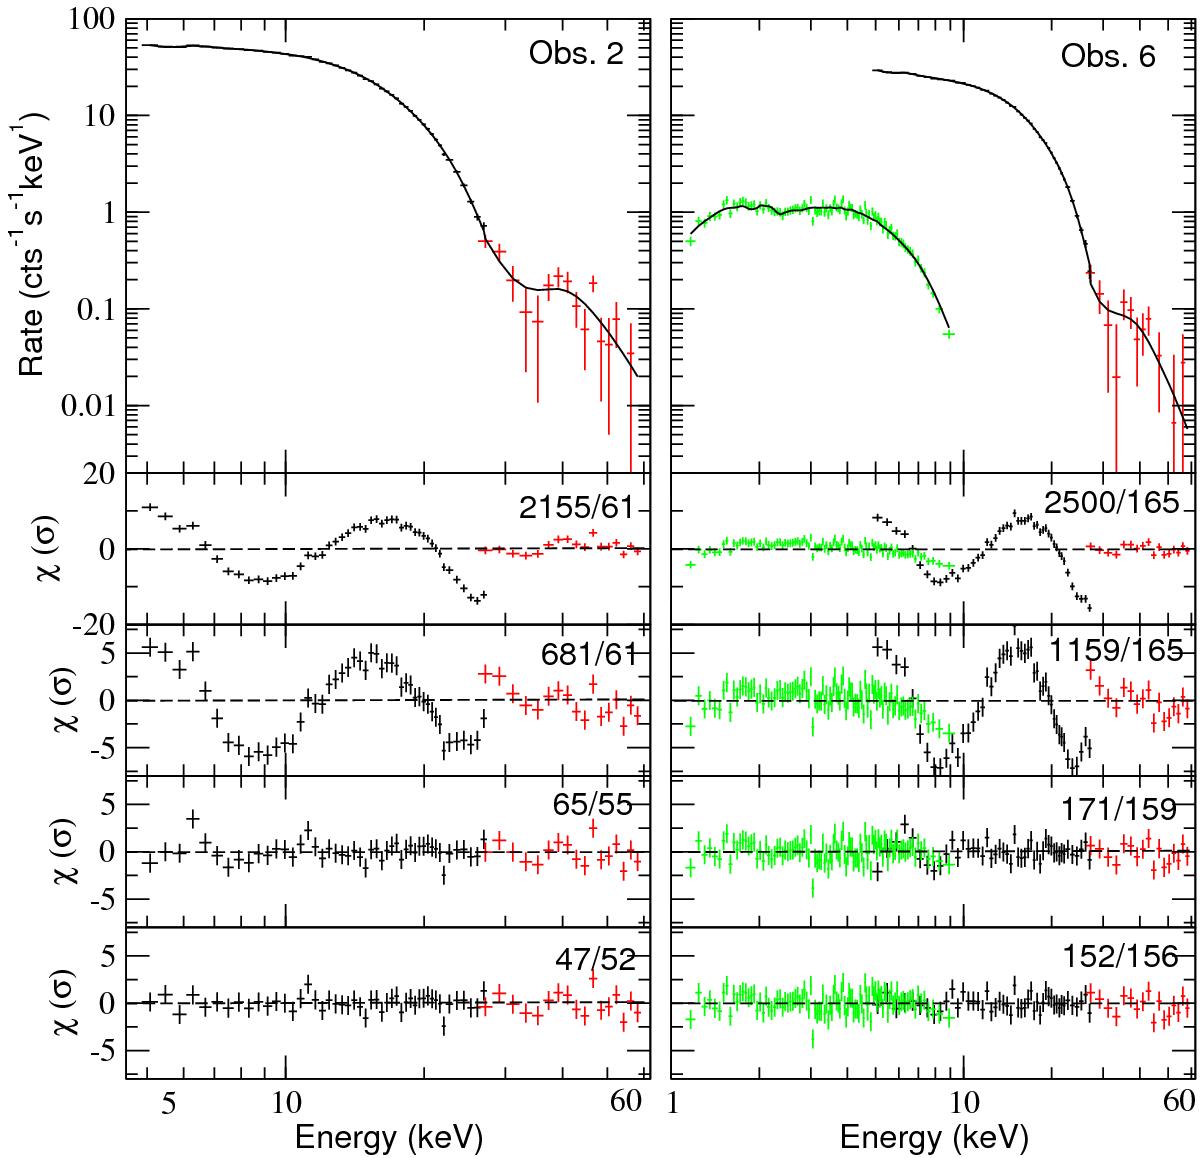
Upper panels, left and right: two example spectra of V 0332+53. Obs. 2 is one of the two observations with the highest count rates while Obs. 6 is the data set with the highest count rate with all the instruments available (black, red, and green correspond to PCA, HEXTE, and XRT, respectively). Lower panels: behaviour of the residuals when adding the different components one by one. The number in the right corner of each panel indicates the best-fit statistics (χ2/d.o.f.). From upper to lower panels: 1) best fit using the cutoffpl model component only (i.e. continuum model); 2) residuals after adding the ≈ 10 keV absorption feature to the continuum model; 3) residuals after adding the cyclotron feature; 4) residuals after adding the Fe Kα line to the model (and final residuals of the model). The same vertical axis is used in both panels.
Current usage metrics show cumulative count of Article Views (full-text article views including HTML views, PDF and ePub downloads, according to the available data) and Abstracts Views on Vision4Press platform.
Data correspond to usage on the plateform after 2015. The current usage metrics is available 48-96 hours after online publication and is updated daily on week days.
Initial download of the metrics may take a while.