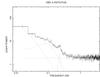
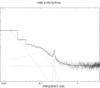
Fig. 5
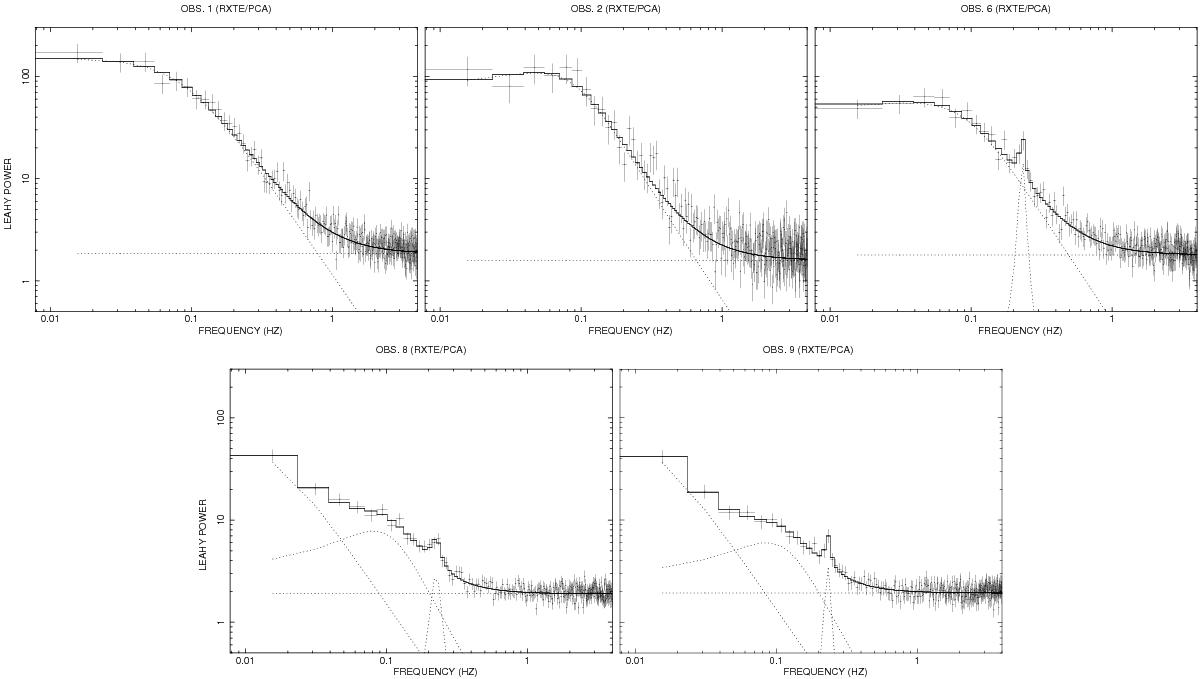
Power density spectra of the RXTE PCA data in the energy and frequency range (2−60 keV) and 0.008−4 Hz, respectively, during observations 1, 2, 6, 8, and 9 (top-left to bottom-right) with the best-fit model (solid line) and the model components (dotted line). The results of the fitting are shown in Table 2 and are discussed in the text.
Current usage metrics show cumulative count of Article Views (full-text article views including HTML views, PDF and ePub downloads, according to the available data) and Abstracts Views on Vision4Press platform.
Data correspond to usage on the plateform after 2015. The current usage metrics is available 48-96 hours after online publication and is updated daily on week days.
Initial download of the metrics may take a while.