Fig. 4
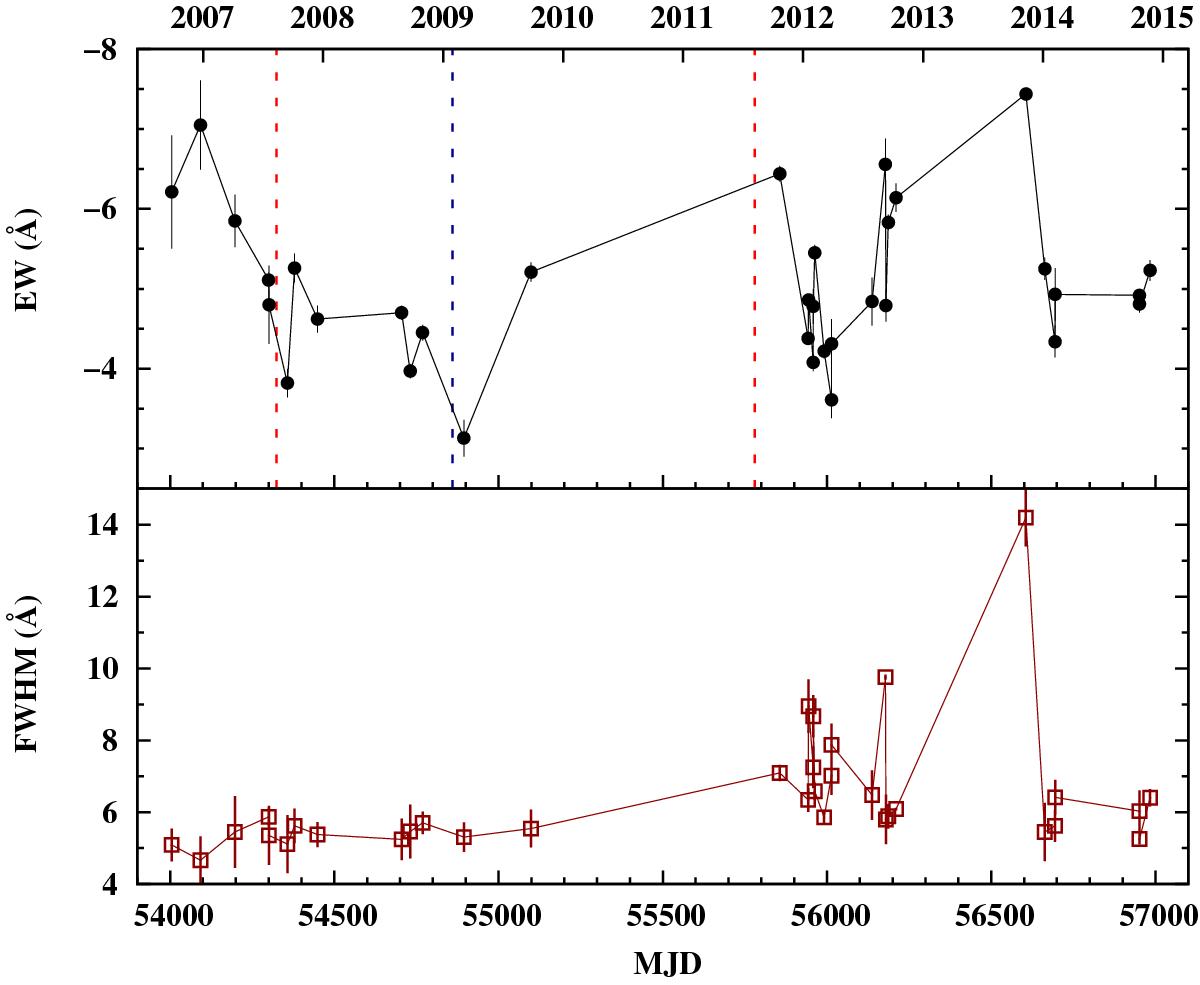
Evolution since 2006 of the EW and FWHM measurements of the Hα emission line. The red dashed vertical lines denote the beginning and the end of the optical outburst seen in ROTSEIIId light curve (see also Fig. 1), whereas the black dashed line shows the time of the turning point (≈ 10 d) from decreasing to increasing trend just after the strong X-ray outburst around MJD ≈ 54 850.
Current usage metrics show cumulative count of Article Views (full-text article views including HTML views, PDF and ePub downloads, according to the available data) and Abstracts Views on Vision4Press platform.
Data correspond to usage on the plateform after 2015. The current usage metrics is available 48-96 hours after online publication and is updated daily on week days.
Initial download of the metrics may take a while.