Free Access
Fig. 1
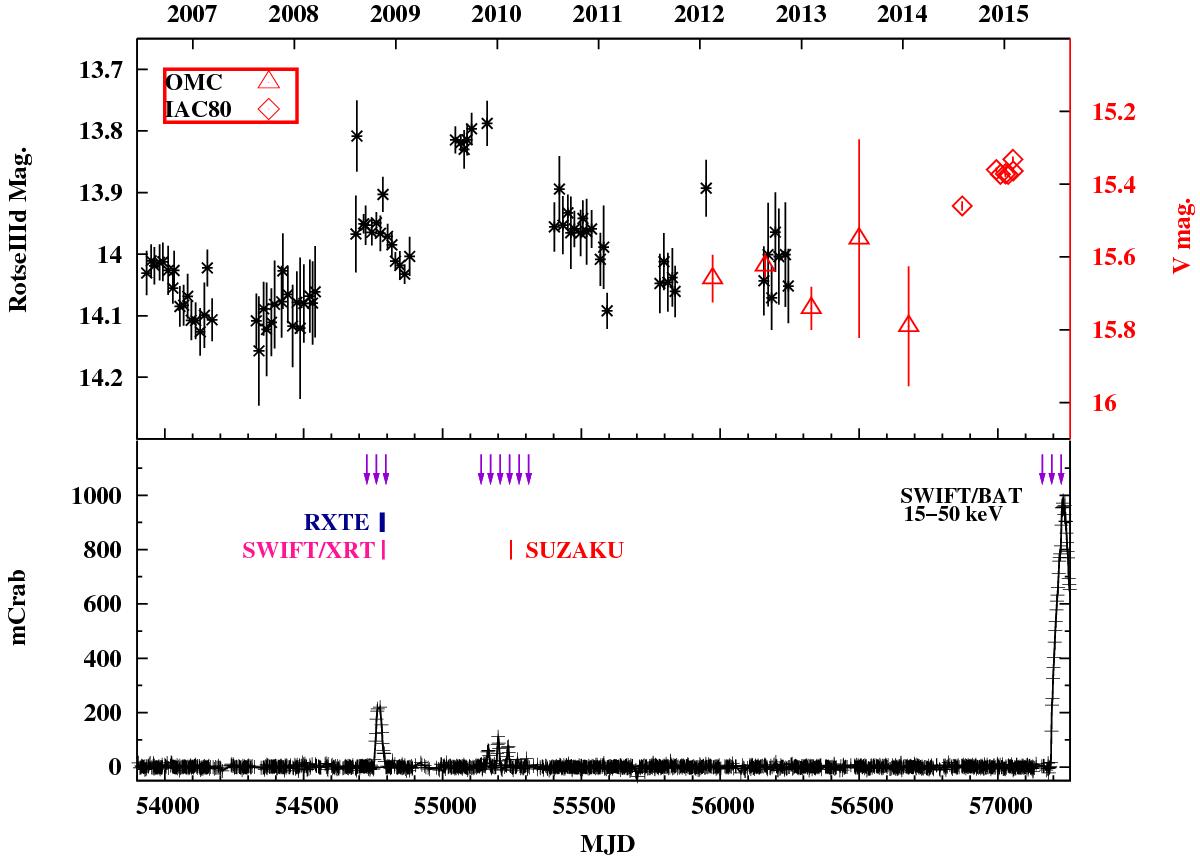
Comparison of the Swift/BAT light curve (15−50 keV) with the optical magnitudes (ROTSE, OMC, IAC80) of V 0332+53 since 2006. The BAT, ROTSE, and OMC data points have been rebinned for clarity. The violet arrows in the X-ray panel represent the times of the periastron passages of the NS.
Current usage metrics show cumulative count of Article Views (full-text article views including HTML views, PDF and ePub downloads, according to the available data) and Abstracts Views on Vision4Press platform.
Data correspond to usage on the plateform after 2015. The current usage metrics is available 48-96 hours after online publication and is updated daily on week days.
Initial download of the metrics may take a while.