Fig. 8
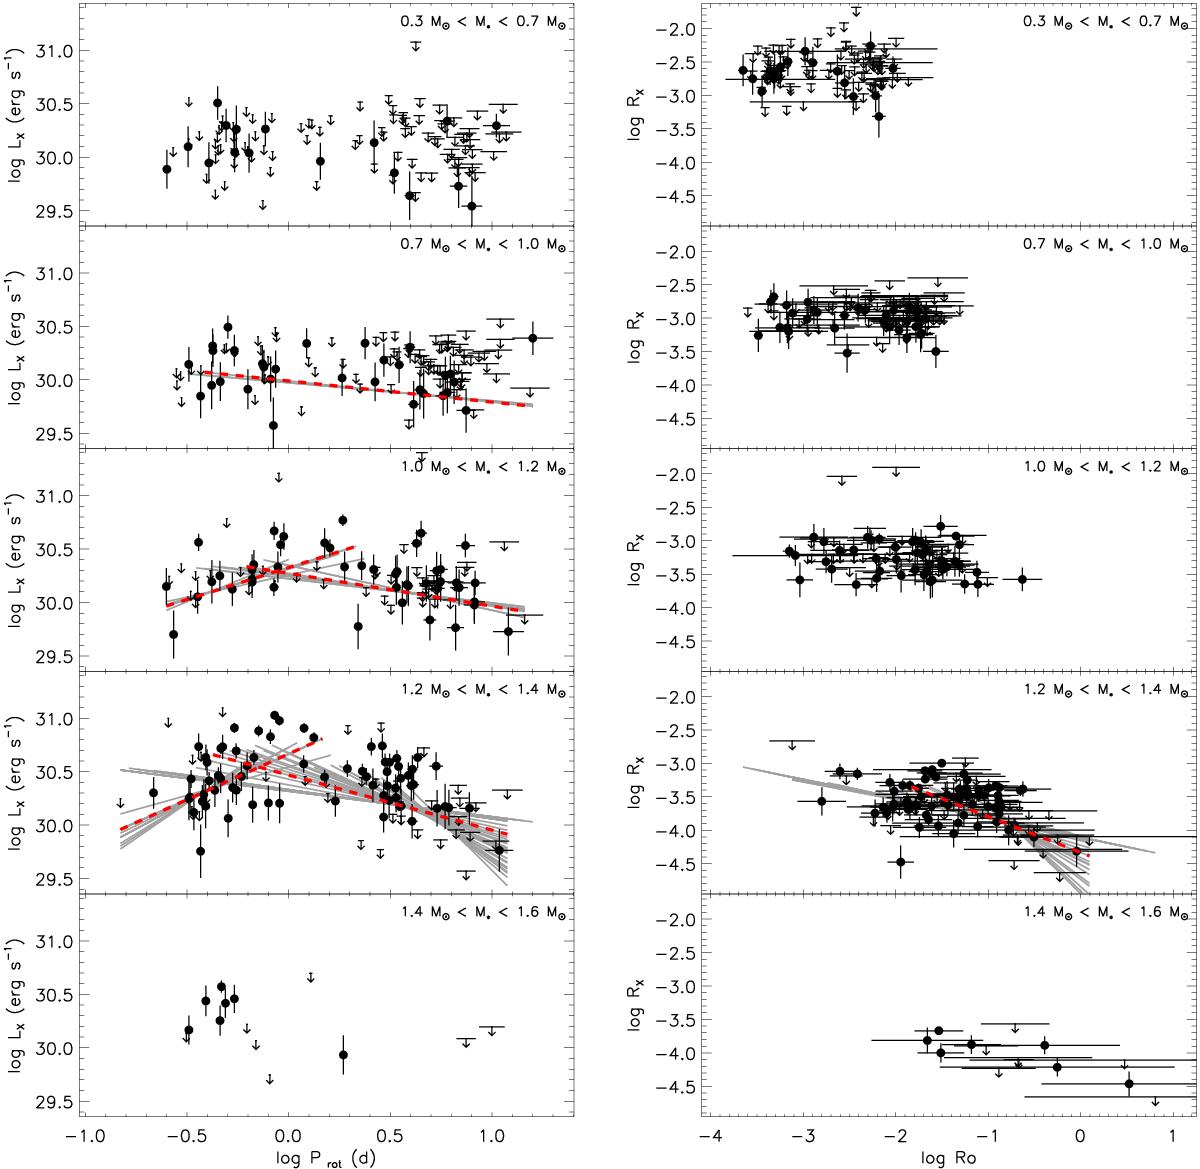
Left panel: X-ray luminosity vs. rotational period for h Per members of different mass. Right panel: fractional X-ray luminosity vs. Rossby number for h Per members of different mass. In both cases gray lines mark the best fit corresponding to intervals in which the two quantities have a significant correlation (confidence level higher than 99%), with red dashed lines indicating the highest significant cases for both positive and negative correlation.
Current usage metrics show cumulative count of Article Views (full-text article views including HTML views, PDF and ePub downloads, according to the available data) and Abstracts Views on Vision4Press platform.
Data correspond to usage on the plateform after 2015. The current usage metrics is available 48-96 hours after online publication and is updated daily on week days.
Initial download of the metrics may take a while.