Fig. 7
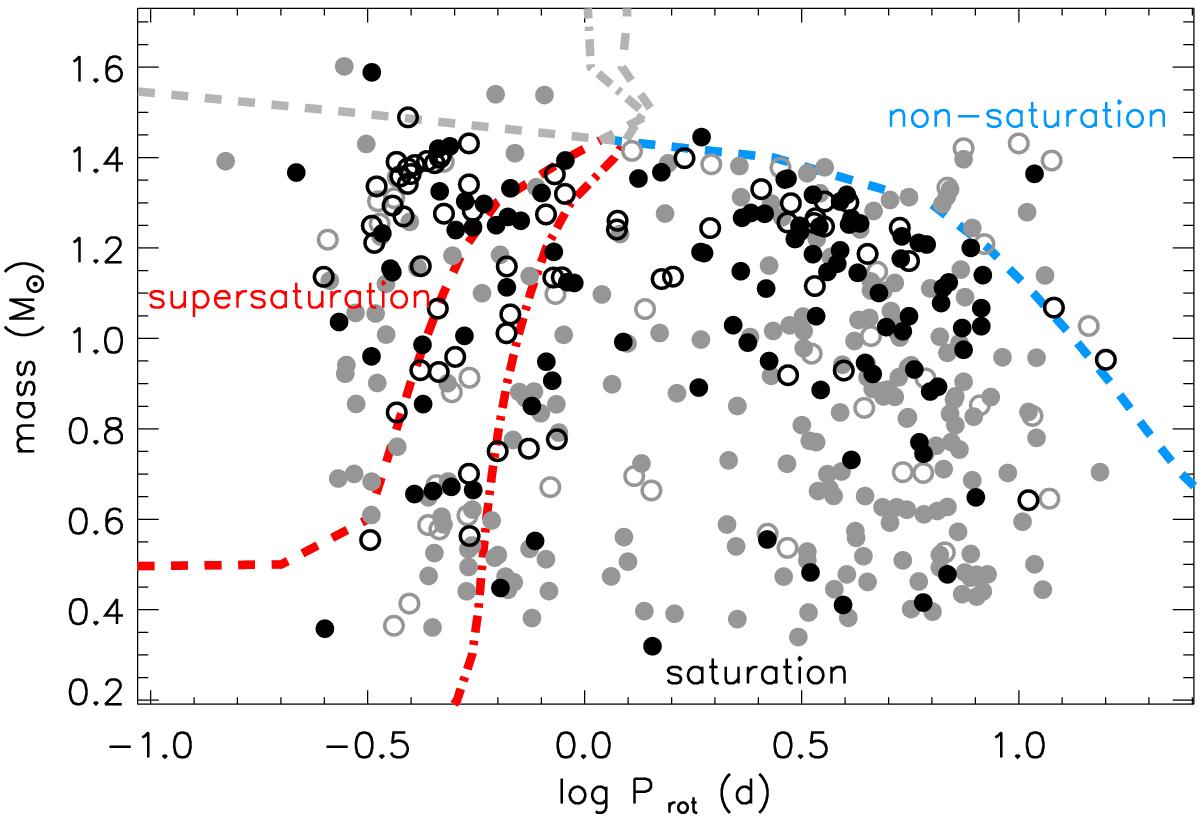
Mass vs. period of X-ray selected h Per members detected (black) and undetected (gray) in X-rays. Filled and open symbols indicate single and binary stars, respectively. Red lines separate the loci corresponding to supersaturation and saturation, assuming centrifugal stripping (dash-dotted line) or polar updraft (dashed line) theories. The blue dashed line marks the expected separation between non-saturation and saturation.
Current usage metrics show cumulative count of Article Views (full-text article views including HTML views, PDF and ePub downloads, according to the available data) and Abstracts Views on Vision4Press platform.
Data correspond to usage on the plateform after 2015. The current usage metrics is available 48-96 hours after online publication and is updated daily on week days.
Initial download of the metrics may take a while.