Fig. 4
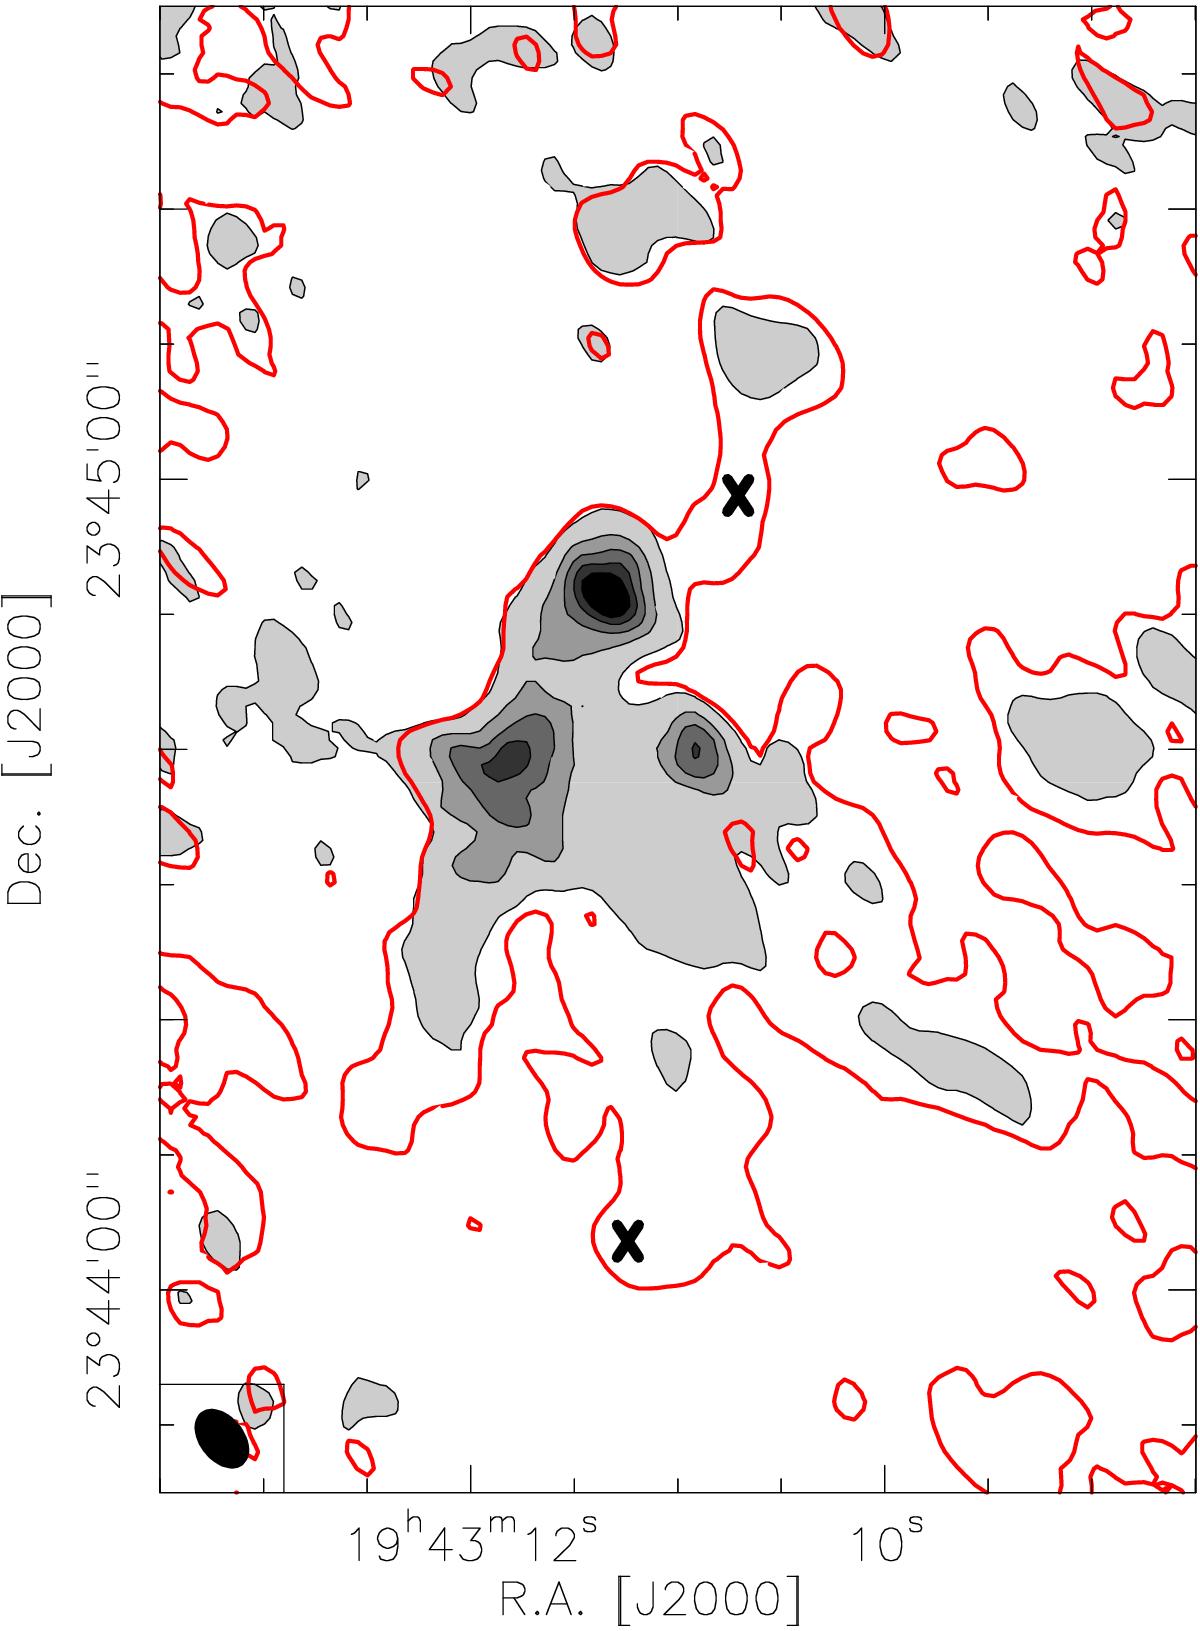
Abundance map of SiO, computed by comparing the column densities of SiO and H2. SiO abundance in gray scale with black contours (contour levels from 7 × 10⁻¹⁰ to 47 × 10-10 by 10 × 10-10). The red contour shows the SiO column density at 1.5 × 1013 cm-2, which is equivalent to the 5σ level and helps to estimate the uncertainty of the map. The two crosses indicate the positions of the two main continuum peaks. For more information on the abundance see Appendix A.
Current usage metrics show cumulative count of Article Views (full-text article views including HTML views, PDF and ePub downloads, according to the available data) and Abstracts Views on Vision4Press platform.
Data correspond to usage on the plateform after 2015. The current usage metrics is available 48-96 hours after online publication and is updated daily on week days.
Initial download of the metrics may take a while.