Fig. 3
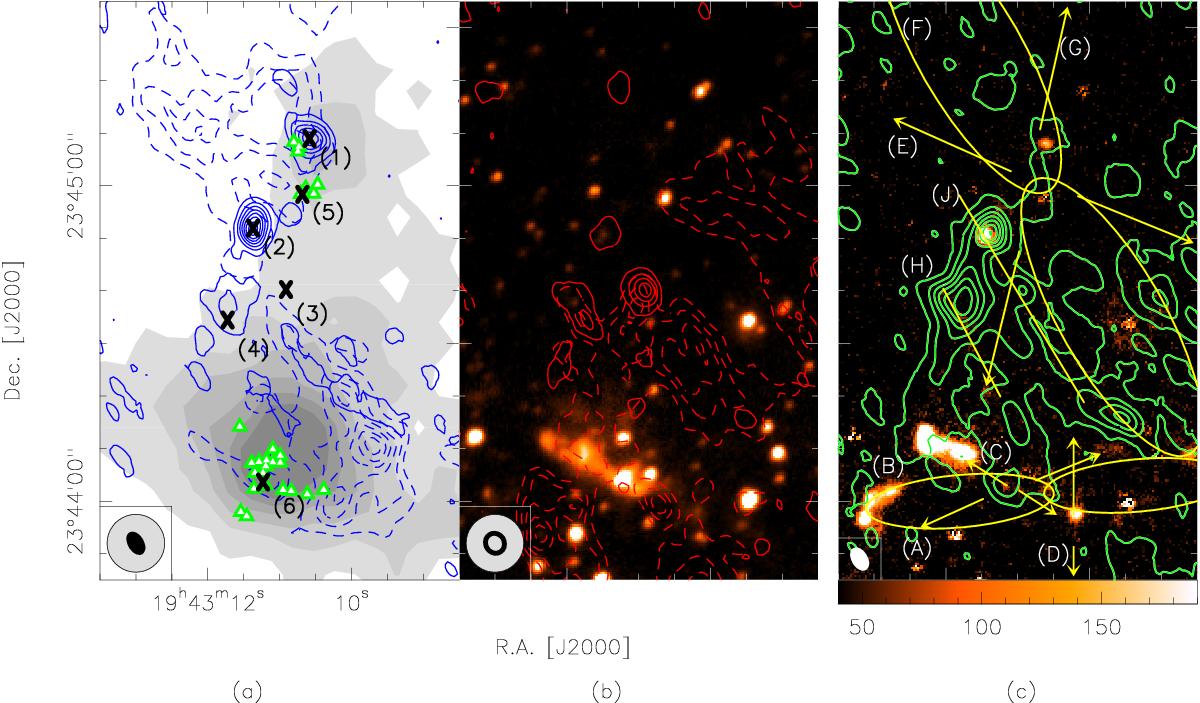
Panels a) and b): comparison of the SiO (2–1) and CO (1–0) data. The left image shows the blueshifted wings of both datasets, with CO in the range 2–18 km s-1 with dotted contours and the SiO 6–19 km s-1 in solid contours. The middle image shows the redshifted counterparts, SiO in solid contours in the area 25–38 km s-1, and CO in dotted contours from 26 to 47 km s-1. The contour levels of the SiO emission are 0.2(0.2)2 Jy beam-1 km s-1 and 2(3)20 Jy beam-1 km s-1 for the CO emission. The background of the left image shows the 1.2 mm continuum data from Beuther et al. (2002c) and the background of the middle image the K-band emission observed by Beuther et al. (2002a). The green triangles in the left image indicate mm-sources from Rodón et al. (2012) and the crosses and numbers label the same points as in Fig. 2. The resolution of the continuum data is shown by the gray circle in the lower left corner, and the black ellipses show the resolution of the SiO (filled) and the CO data (open). Panel c): SiO emission at ambient velocity in green contours (integrated from 19 to 25 km s-1, contour levels 0.2(0.4)2 Jy beam-1 km s-1) with the H2 emission in the background and the proposed outflows in yellow lines, arrows, and ellipses. CO and H2 data, as well as the proposed outflows, are from Beuther et al. (2003).
Current usage metrics show cumulative count of Article Views (full-text article views including HTML views, PDF and ePub downloads, according to the available data) and Abstracts Views on Vision4Press platform.
Data correspond to usage on the plateform after 2015. The current usage metrics is available 48-96 hours after online publication and is updated daily on week days.
Initial download of the metrics may take a while.