Fig. 2
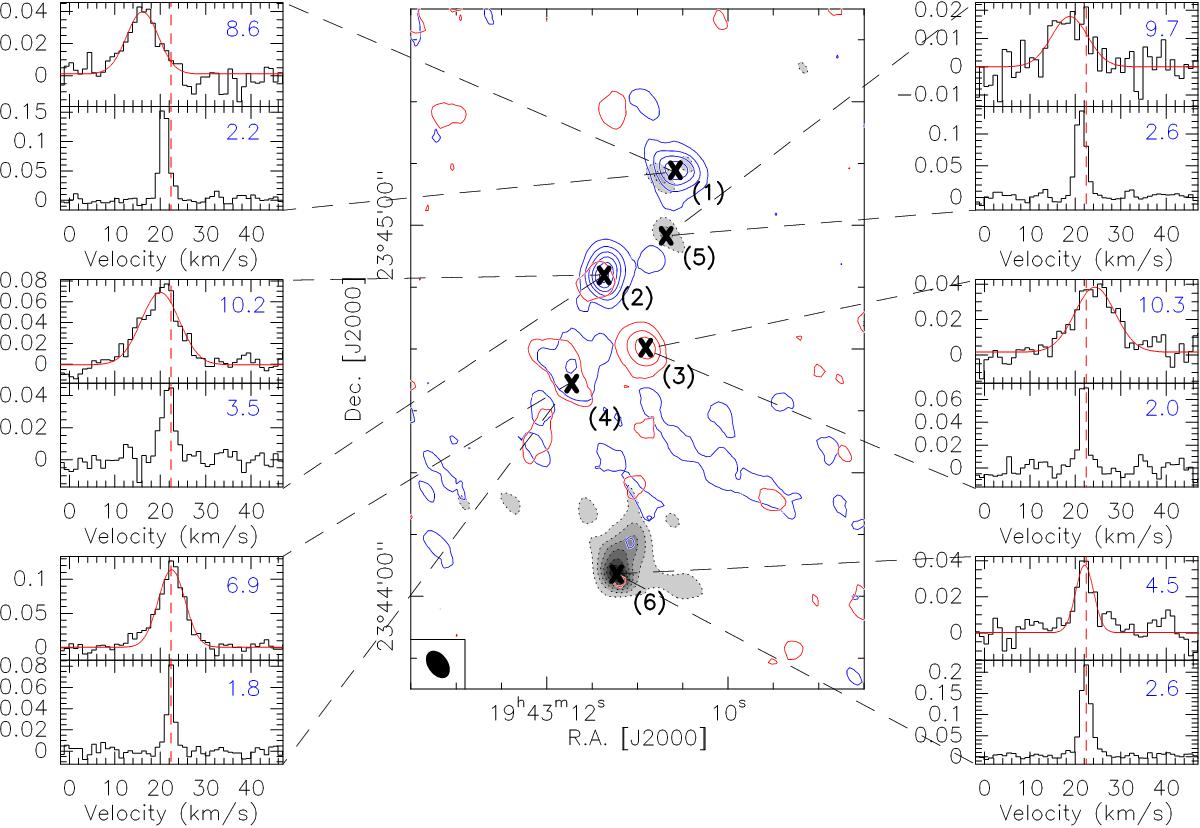
Central panel: integrated intensity of the blue and redshifted wing of the SiO (2–1) emission. In blue contours the blueshifted wing is shown, integrated from 6 km s-1 to 19 km s-1 (levels 0.2(0.2)2 Jy beam-1 km s-1). The red contours show the redshifted wing, integrated from 25 km s-1 to 38 km s-1 (levels 0.2(0.2)2 Jy beam-1 km s-1). In the background, the 3 mm continuum data in gray and dotted contours (levels 1.5(1.5)10 Jy beam-1) are shown. Left and right sides: spectra at different points. For each point, the upper spectrum is from SiO and the lower one from H13CO+, each in the units of Jy beam-1. The red dotted line shows the rest velocity of 22.4 km s-1 and the blue number at the upper right of each spectrum the FWHM of the fitted Gaussian in km s-1. In the SiO spectra, the fitted Gaussians are shown with red lines.
Current usage metrics show cumulative count of Article Views (full-text article views including HTML views, PDF and ePub downloads, according to the available data) and Abstracts Views on Vision4Press platform.
Data correspond to usage on the plateform after 2015. The current usage metrics is available 48-96 hours after online publication and is updated daily on week days.
Initial download of the metrics may take a while.