Fig. 1
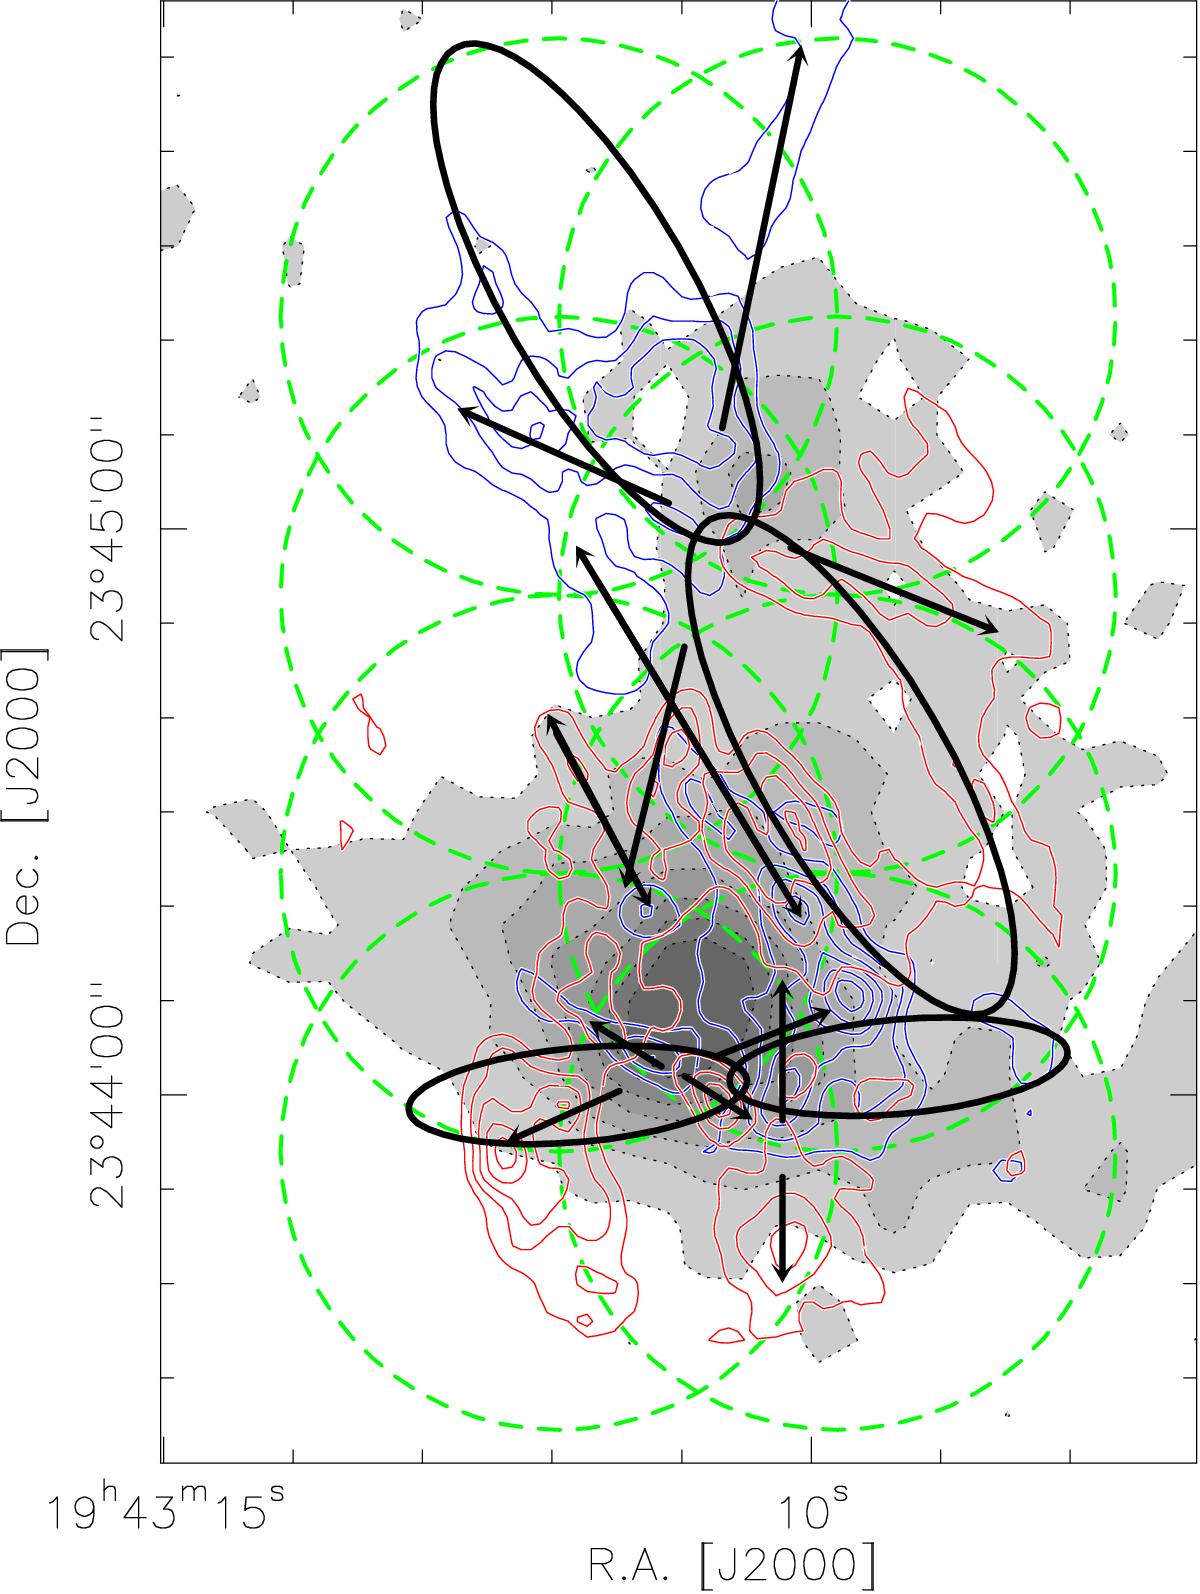
Proposed outflows by Beuther et al. (2003) shown by ellipses and arrows. The proposal of the outflows is based on the line wing data of CO (1–0), as shown in the figure in blue and red contours. The blue contours show the line emission from CO, integrated from 2 to 18 km s-1, and the red ones show the emission integrated from 26 to 47 km s-1. The contour levels are in both cases from 2 to 20 Jy beam-1 km s-1 in steps of 3 Jy beam-1 km s-1, in short 2(3)20 Jy beam-1 km s-1. The background shows the 1.2 mm continuum data from Beuther et al. (2002c) in gray scale with dotted contours (the contour levels are 100(100)700 mJy beam-1). The green dotted circles show the mosaic coverage of our new interferometric observations.
Current usage metrics show cumulative count of Article Views (full-text article views including HTML views, PDF and ePub downloads, according to the available data) and Abstracts Views on Vision4Press platform.
Data correspond to usage on the plateform after 2015. The current usage metrics is available 48-96 hours after online publication and is updated daily on week days.
Initial download of the metrics may take a while.