Fig. 9
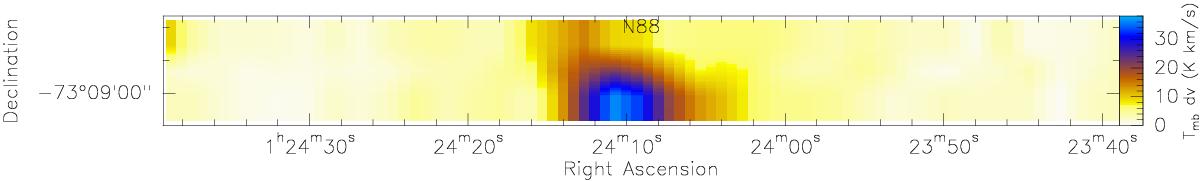
N 88 total [ CII ] emission strip map obtained with GREAT, by integration over the velocity range VLSR = 142.5−157.5 km s-1. The [ CII ] emission is mostly limited to a bright peak coincident with the compact HII region, although it is surrounded by a small region of lower intensity. There is very little [ CII ] emission in the rest of the map.
Current usage metrics show cumulative count of Article Views (full-text article views including HTML views, PDF and ePub downloads, according to the available data) and Abstracts Views on Vision4Press platform.
Data correspond to usage on the plateform after 2015. The current usage metrics is available 48-96 hours after online publication and is updated daily on week days.
Initial download of the metrics may take a while.