Fig. 8
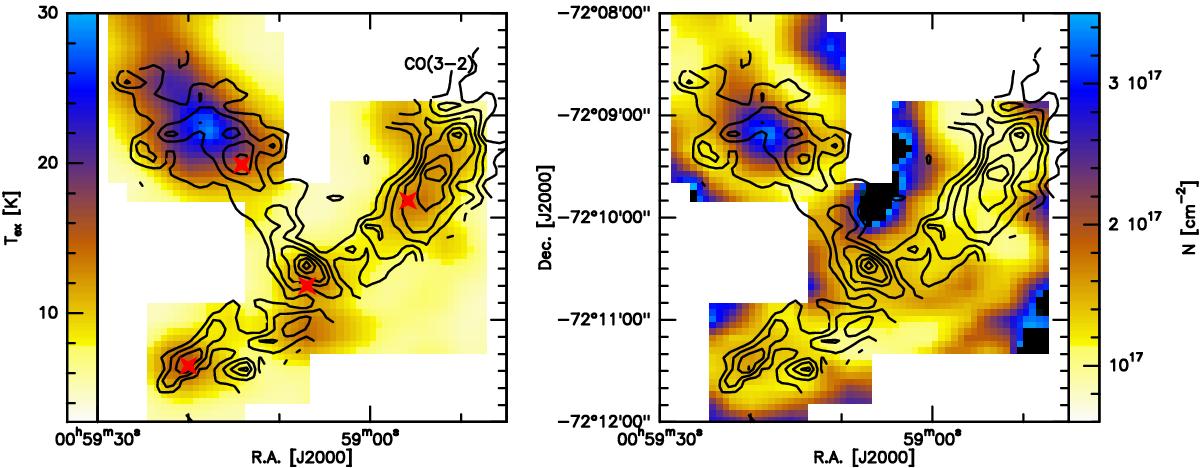
Maps of the LTE excitation temperature and column density for the CO molecule in N 66, calculated assuming a η of 0.1 to account for the filling factors. Left: CO excitation temperature; stars represent the positions that have been used in Table 3. Right: CO column densities. In all panels, black contours refer to the [ CII ] integrated intensity as in Fig. 1.
Current usage metrics show cumulative count of Article Views (full-text article views including HTML views, PDF and ePub downloads, according to the available data) and Abstracts Views on Vision4Press platform.
Data correspond to usage on the plateform after 2015. The current usage metrics is available 48-96 hours after online publication and is updated daily on week days.
Initial download of the metrics may take a while.