Fig. 6
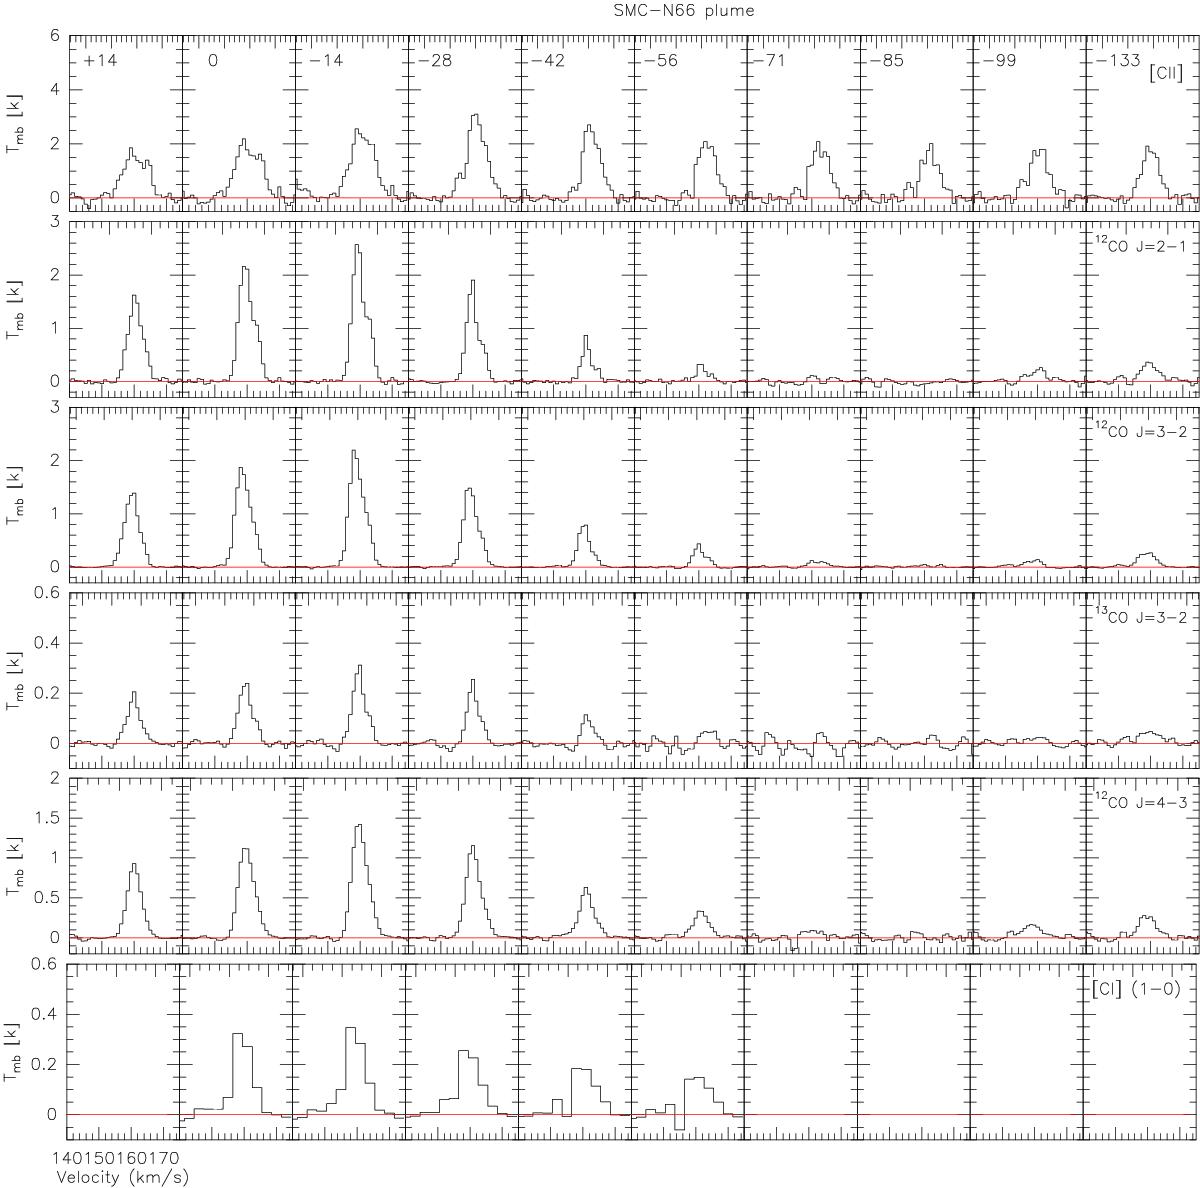
Line profiles along the N 66 plume, taken from the maps in Figs. 2 and 3, following the plume emission as shown in Fig. A.3. All profiles are at a uniform resolution of 27.3′′. Vertical scales are main-beam brightness temperature Tmb. Velocities range from VLSR = 140 km s-1 to VLSR = 175 km s-1 and are marked at intervals of 2 km s-1.
Current usage metrics show cumulative count of Article Views (full-text article views including HTML views, PDF and ePub downloads, according to the available data) and Abstracts Views on Vision4Press platform.
Data correspond to usage on the plateform after 2015. The current usage metrics is available 48-96 hours after online publication and is updated daily on week days.
Initial download of the metrics may take a while.