Fig. 5
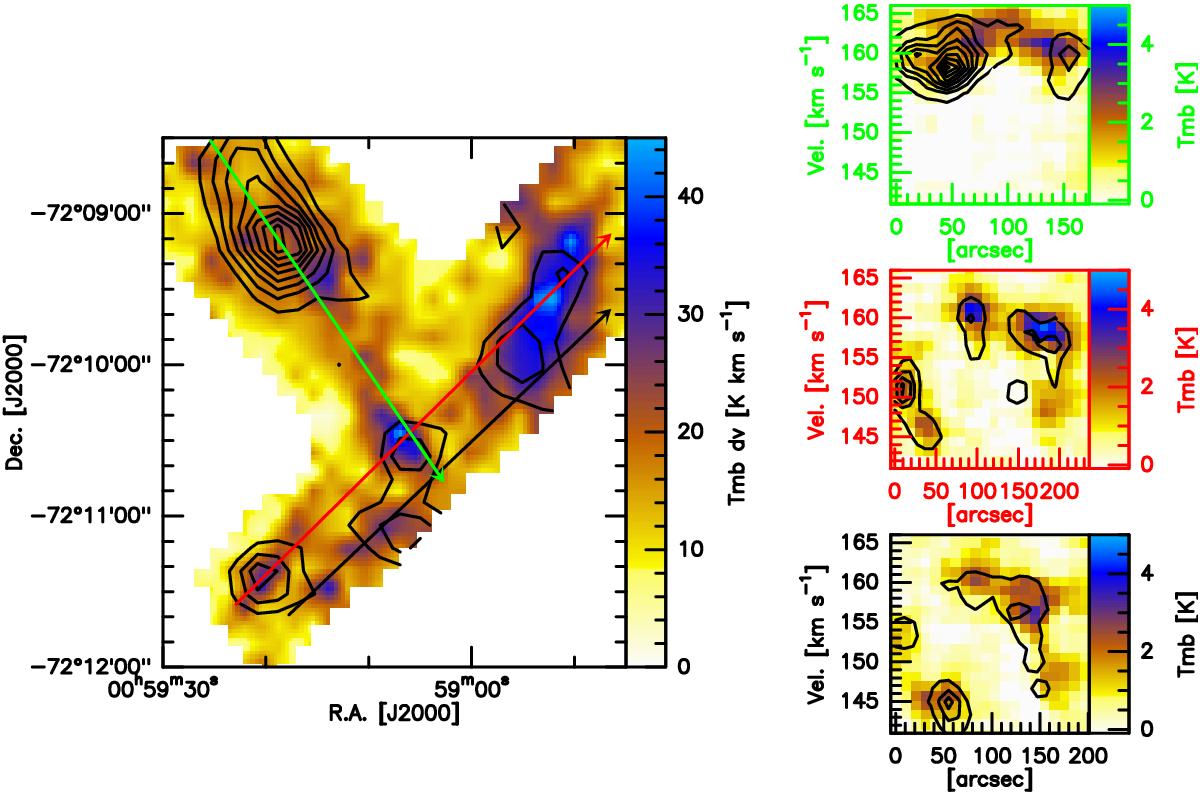
Diagrams of the velocity structure of the N 66 gas. The left panel shows the velocity-integrated intensity of [ CII ] in color (K km s-1 scale), with the integrated intensity of the CO (3−2) transition superposed in black contours (starting at 3 K km s-1 increasing in steps of 2 K km s-1). The three panels at the right contain the position-velocity maps along the cuts indicated in the left panel, with position (in arcsec) increasing along the direction indicated by the arrows in that panel. Note the ring-like distribution of clumpy emission in the ridge depicted in the lower two panels. The panel at the top contains the orthogonal cut through the plume, showing more continuous and brighter emission.
Current usage metrics show cumulative count of Article Views (full-text article views including HTML views, PDF and ePub downloads, according to the available data) and Abstracts Views on Vision4Press platform.
Data correspond to usage on the plateform after 2015. The current usage metrics is available 48-96 hours after online publication and is updated daily on week days.
Initial download of the metrics may take a while.