Fig. 2
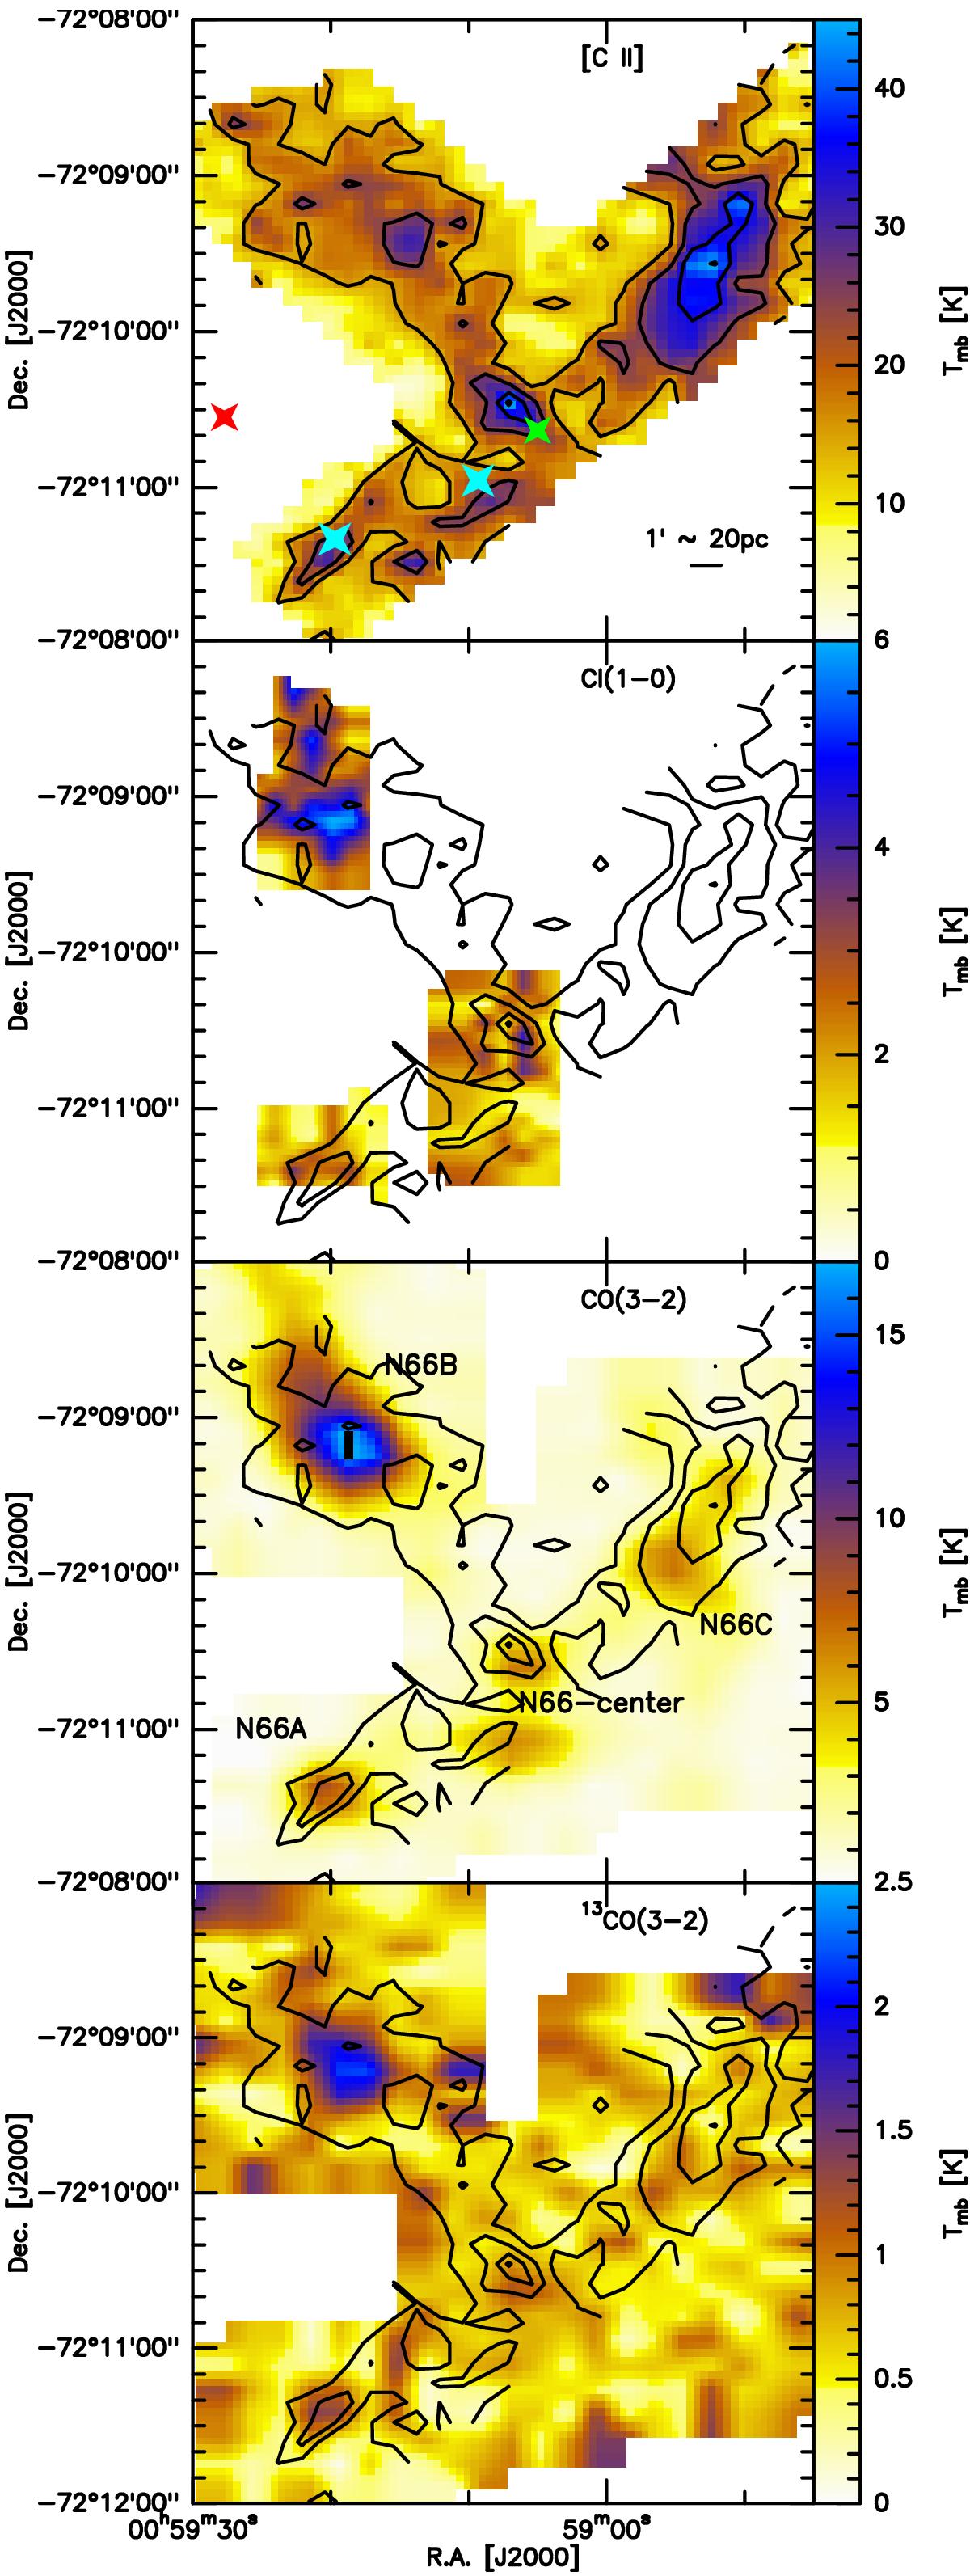
Integrated intensity maps between LSR velocities of 141 to 166 km s-1 (in color) of N 66 for the [ CII ], [ CI ] (3P1–3P0), CO (3−2) and 13CO (3−2) emission. For comparison, we have superposed the contours of the [ CII ] integrated intensity in black. As in Fig. 1, we have marked the star cluster NGC 346 by a green star, water masers by blue stars, and the supernova by a red star in the top panel. In the CO (3−2) panel we have marked the different components of the N66 structure discussed in the text.
Current usage metrics show cumulative count of Article Views (full-text article views including HTML views, PDF and ePub downloads, according to the available data) and Abstracts Views on Vision4Press platform.
Data correspond to usage on the plateform after 2015. The current usage metrics is available 48-96 hours after online publication and is updated daily on week days.
Initial download of the metrics may take a while.