Fig. 13
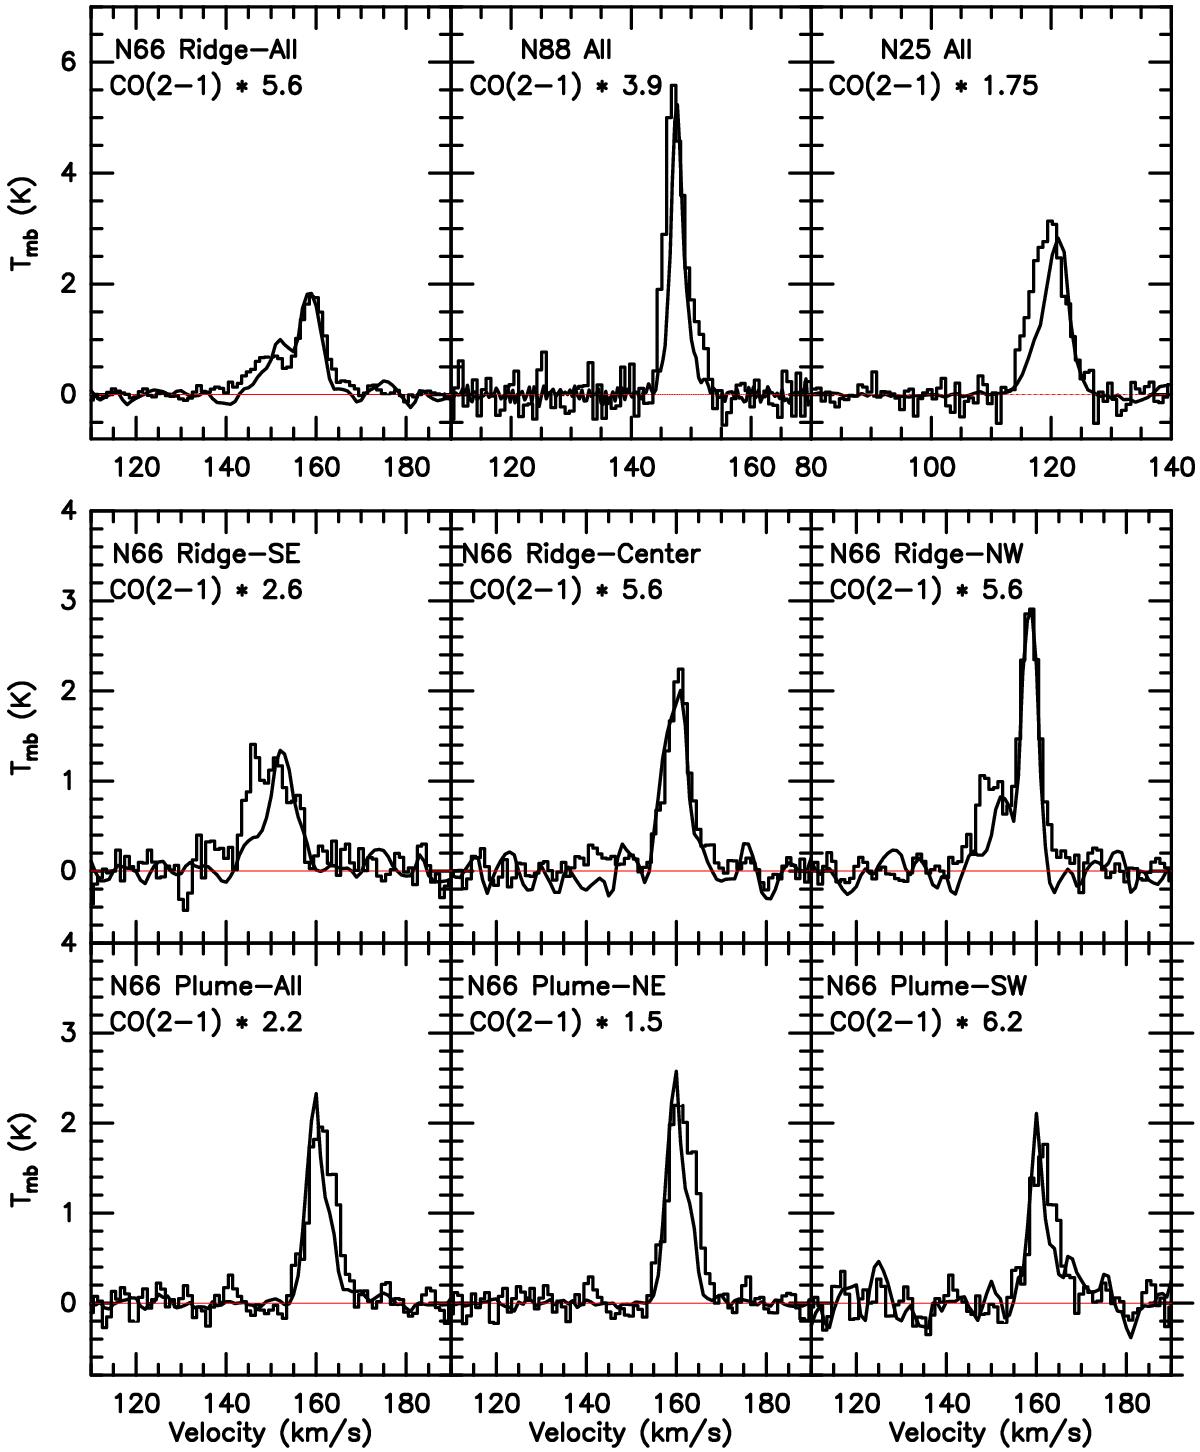
Comparison of observed [ CII ] (histogram) and CO (2−1) (continuous line) profiles from SMC star-forming regions. In each panel the spatially averaged (27.3′′) profile is shown according to the legend in the upper left corner. The vertical scale is in main-beam brightness temperature Tmb in Kelvin. All CO (2−1) amplitudes have been multiplied by the factors indicated in each panel to match the [ CII ] profile as closely as possible. We note the very close overall similarity of [ CII ] and CO profiles.
Current usage metrics show cumulative count of Article Views (full-text article views including HTML views, PDF and ePub downloads, according to the available data) and Abstracts Views on Vision4Press platform.
Data correspond to usage on the plateform after 2015. The current usage metrics is available 48-96 hours after online publication and is updated daily on week days.
Initial download of the metrics may take a while.