Fig. 11
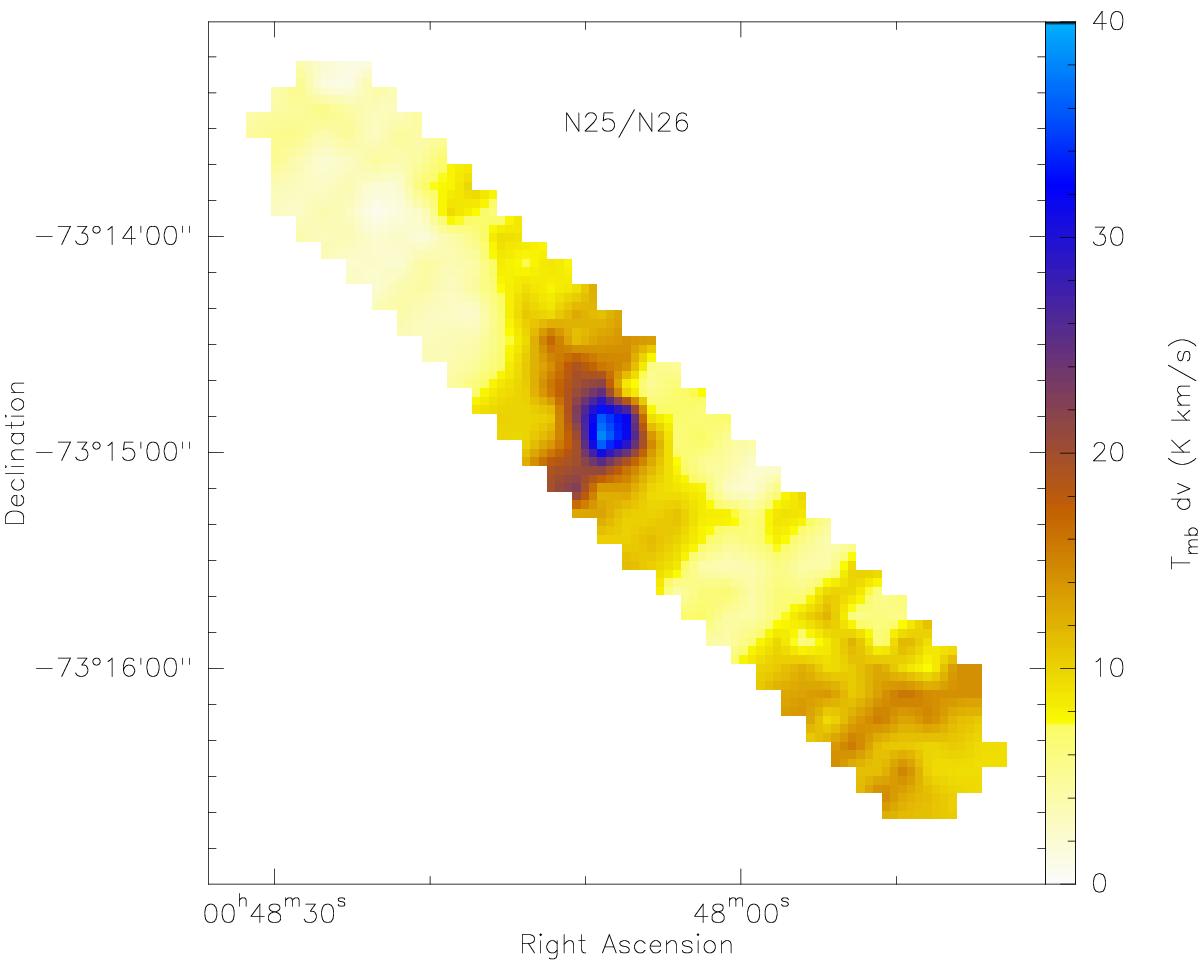
N 25+N 26 [ CII ] emission strip map obtained with GREAT by integration over the velocity range VLSR = 110−130 km s-1. The bright [ CII ] emission peak at the location of the compact HII regions is obvious, as is the extended diffuse emission surrounding it. The weak emission in the southwest is associated with the N 22 molecular cloud.
Current usage metrics show cumulative count of Article Views (full-text article views including HTML views, PDF and ePub downloads, according to the available data) and Abstracts Views on Vision4Press platform.
Data correspond to usage on the plateform after 2015. The current usage metrics is available 48-96 hours after online publication and is updated daily on week days.
Initial download of the metrics may take a while.