Fig. 1
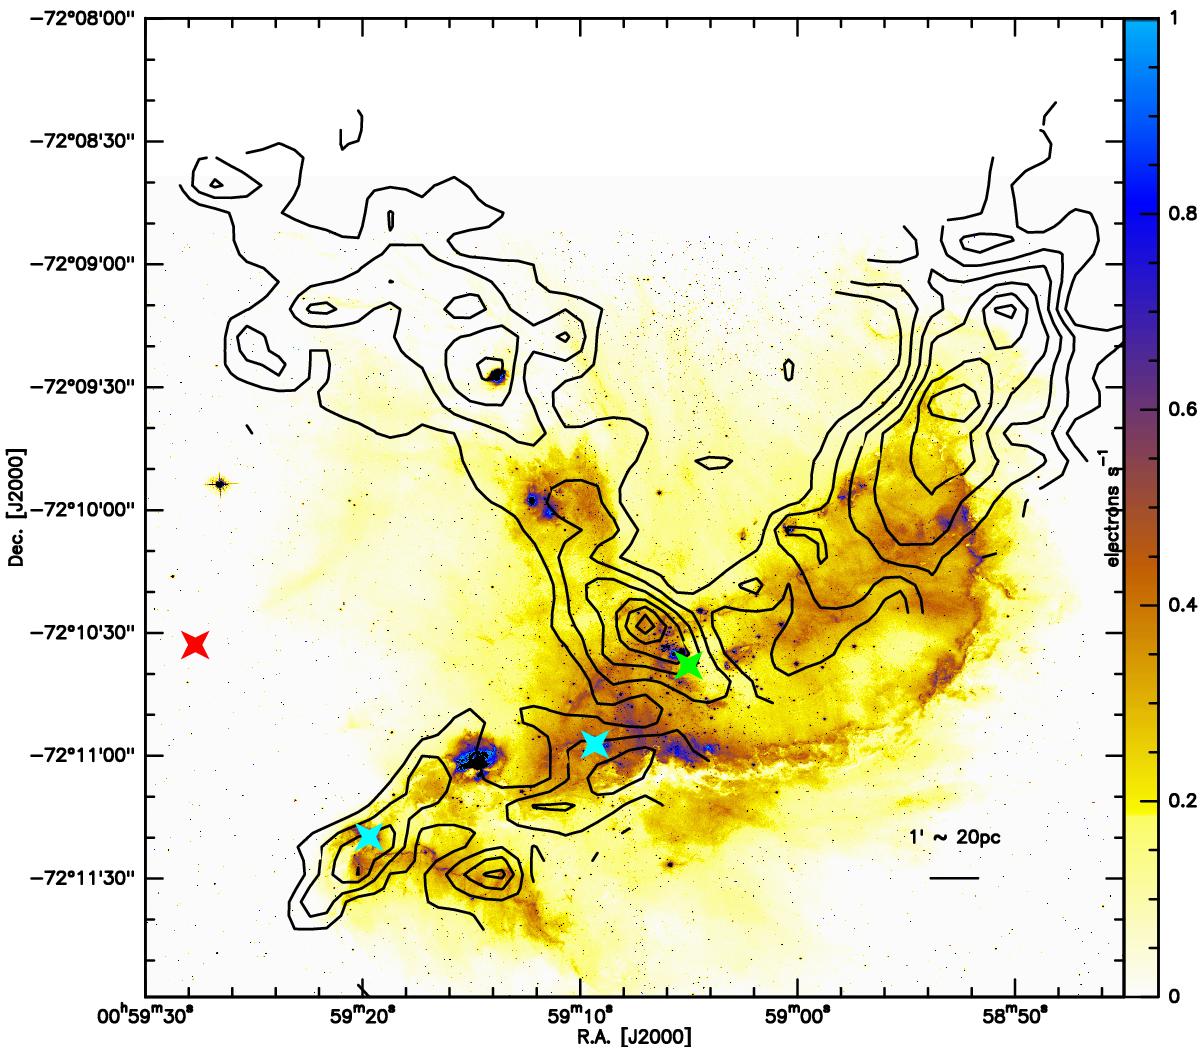
Hα map in N66 observed by HST (ACS WFC1 archival data, Nota et al. 2006). The units are electrons per second, and the conversion factor 1.99 × 10⁻¹⁸ergs cm-2 Ang-1 electron-1. We show superposed in black the contours of the [ CII ] integrated intensity (in K km s-1, integrated over the LSR velocity interval of 141 to 166 km s-1) from the present work. We have marked the position of the stellar cluster NGC 346 by a green star, detected water masers by blue stars, and the supernovae by red star.
Current usage metrics show cumulative count of Article Views (full-text article views including HTML views, PDF and ePub downloads, according to the available data) and Abstracts Views on Vision4Press platform.
Data correspond to usage on the plateform after 2015. The current usage metrics is available 48-96 hours after online publication and is updated daily on week days.
Initial download of the metrics may take a while.