Fig. 8
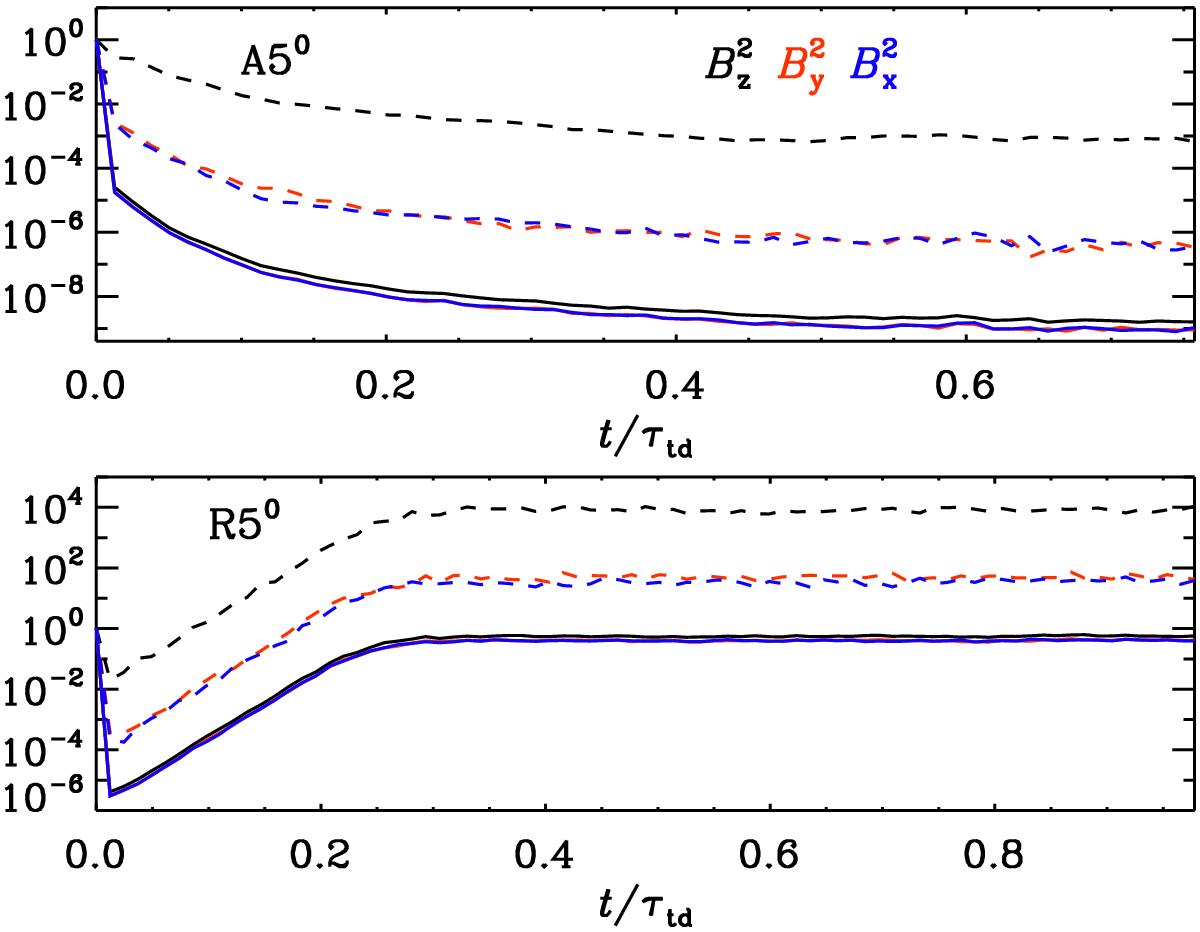
Temporal evolution of the horizontally averaged magnetic energy density at the surface (z = 0) for Runs A50 and R50, where B0 = 0. The three components are shown in blue (x), red (y), and black (z), where solid lines indicate the total magnetic energy and dashed lines the large-scale magnetic energy. All values are normalized by their values at t/τtd = 0.
Current usage metrics show cumulative count of Article Views (full-text article views including HTML views, PDF and ePub downloads, according to the available data) and Abstracts Views on Vision4Press platform.
Data correspond to usage on the plateform after 2015. The current usage metrics is available 48-96 hours after online publication and is updated daily on week days.
Initial download of the metrics may take a while.