Fig. 6
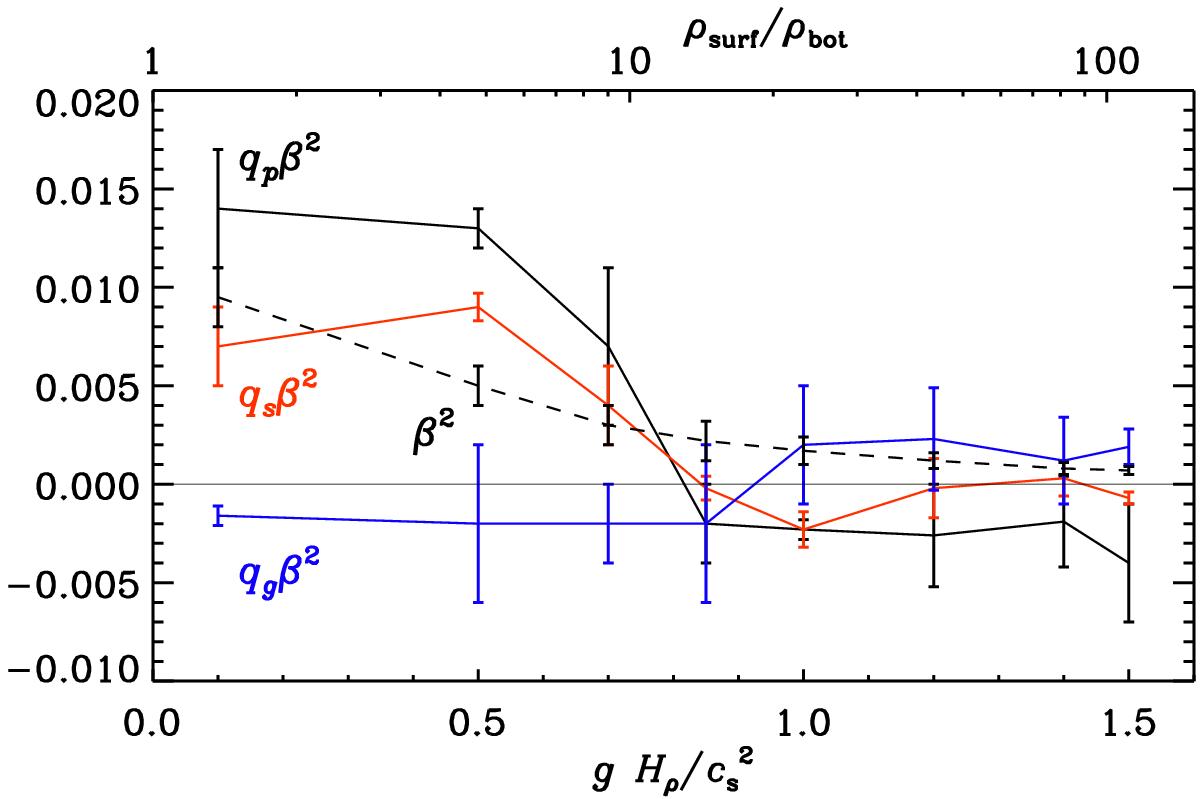
Dependence of parameters qp (black), qs (red), and qg (blue) on stratification for Set A. We normalize the parameters by multiplying with β2 (dashed black). The legend of the x-axis is the same as in Fig. 3. The parameters are computed as a temporal and spatial mean over the turbulent layer. Error bars are estimated using the maximum difference of the total mean with the means of each third of the time series.
Current usage metrics show cumulative count of Article Views (full-text article views including HTML views, PDF and ePub downloads, according to the available data) and Abstracts Views on Vision4Press platform.
Data correspond to usage on the plateform after 2015. The current usage metrics is available 48-96 hours after online publication and is updated daily on week days.
Initial download of the metrics may take a while.