Fig. 4
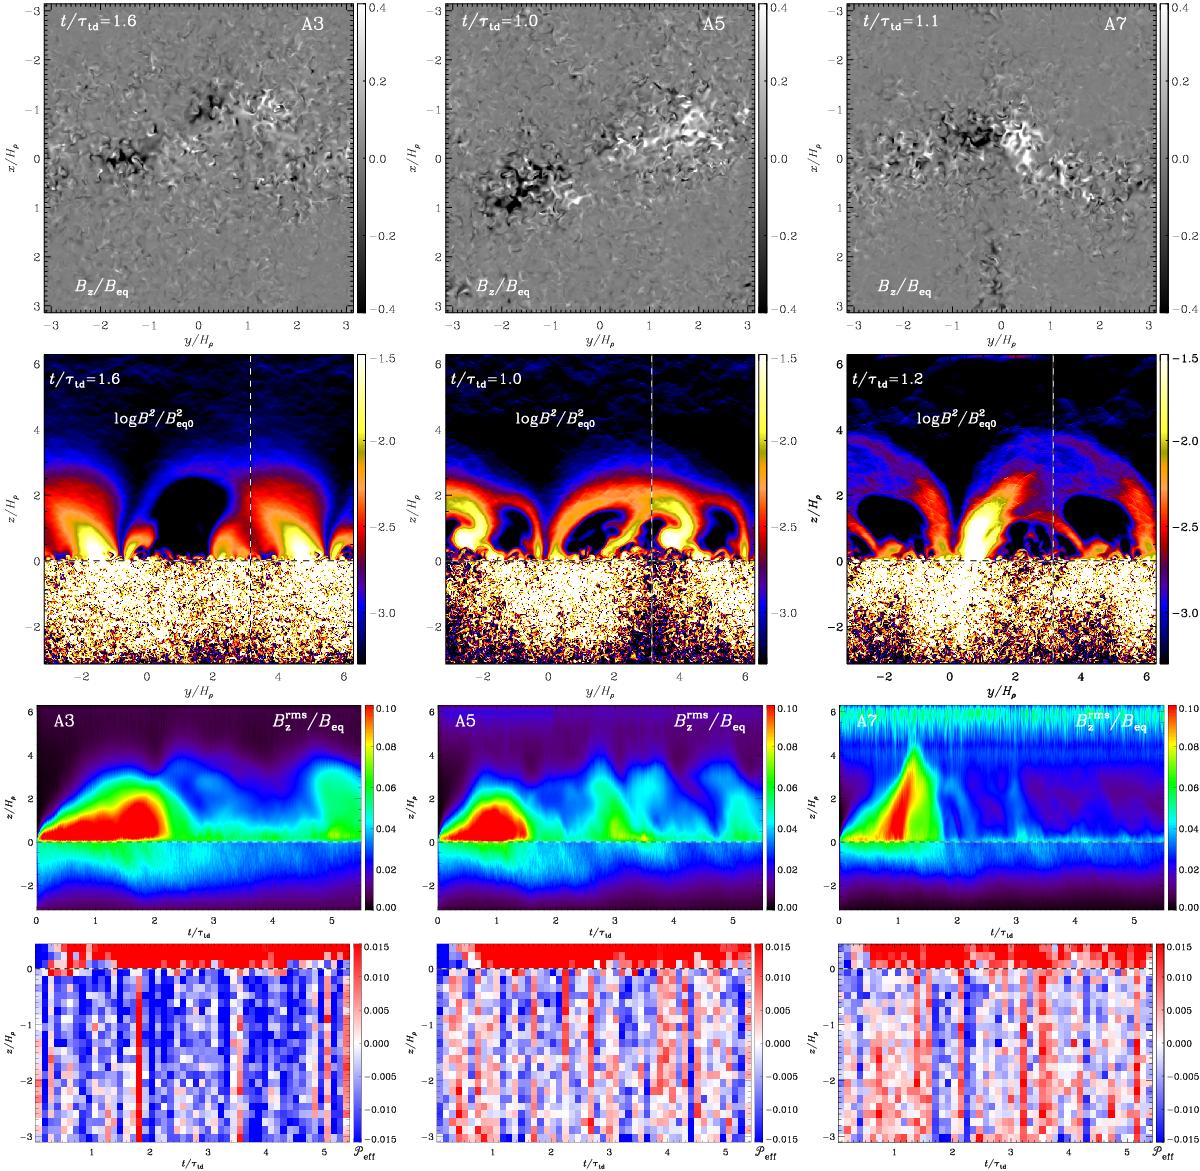
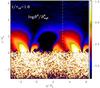
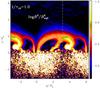
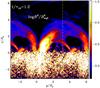
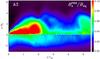
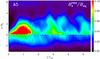
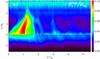
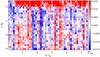
Formation of bipolar regions for three different stratifications (left column: A3, middle: A5, right: A7). Top row: normalized vertical magnetic field Bz/Beq plotted at the xy surface (z = 0) at times when the bipolar regions are the clearest. Second row: normalized magnetic energy density plotted in the yz plane as a vertical cut through the bipolar region at x = 0. We replicated the domain by 50% in the y direction (indicated by the vertical dashed lines) to give a more complete impression about spot separation and arch length. The black-white dashed lines indicate the replicated part and in the last three rows the surface (z = 0). Third row: vertical rms magnetic field ![]() normalized by the local equipartition value (see Fig. 1 for vertical profiles) as a function of t/τtd and z/Hρ. Bottom row: smoothed effective magnetic pressure
normalized by the local equipartition value (see Fig. 1 for vertical profiles) as a function of t/τtd and z/Hρ. Bottom row: smoothed effective magnetic pressure ![]() as a function of t/τtd and z/Hρ. Blue shades correspond to negative and red to positive values.
as a function of t/τtd and z/Hρ. Blue shades correspond to negative and red to positive values.
Current usage metrics show cumulative count of Article Views (full-text article views including HTML views, PDF and ePub downloads, according to the available data) and Abstracts Views on Vision4Press platform.
Data correspond to usage on the plateform after 2015. The current usage metrics is available 48-96 hours after online publication and is updated daily on week days.
Initial download of the metrics may take a while.