Fig. 13
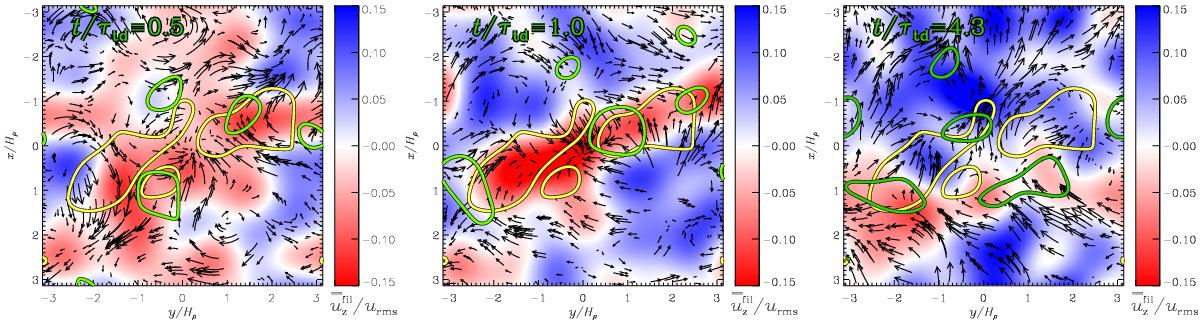
All three large-scale velocity components ![]() ,
, ![]() , and
, and ![]() before (t/τtd = 0.5), at (t/τtd = 1.0), and after (t/τtd = 4.3) the occurrence of the bipolar regions (compare with Fig. 4) in the xy plane for Run A5. The vertical velocity is plotted as red (downflows) and blue (upflows) and are normalized by the urms in the bulk of the turbulent layer (z ≤ 0). The horizontal components of the velocity field are shown as arrows, where the lengths corresponds to the strength of the flow. Additionally, the contours of negative horizontal divergence is plotted in green for all three times. The yellow contours in all plots show the magnetic field at the time (t/τtd = 1.0) to guide the eye to the location of the bipolar region formation.
before (t/τtd = 0.5), at (t/τtd = 1.0), and after (t/τtd = 4.3) the occurrence of the bipolar regions (compare with Fig. 4) in the xy plane for Run A5. The vertical velocity is plotted as red (downflows) and blue (upflows) and are normalized by the urms in the bulk of the turbulent layer (z ≤ 0). The horizontal components of the velocity field are shown as arrows, where the lengths corresponds to the strength of the flow. Additionally, the contours of negative horizontal divergence is plotted in green for all three times. The yellow contours in all plots show the magnetic field at the time (t/τtd = 1.0) to guide the eye to the location of the bipolar region formation.
Current usage metrics show cumulative count of Article Views (full-text article views including HTML views, PDF and ePub downloads, according to the available data) and Abstracts Views on Vision4Press platform.
Data correspond to usage on the plateform after 2015. The current usage metrics is available 48-96 hours after online publication and is updated daily on week days.
Initial download of the metrics may take a while.