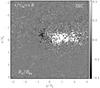
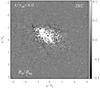
Fig. 11
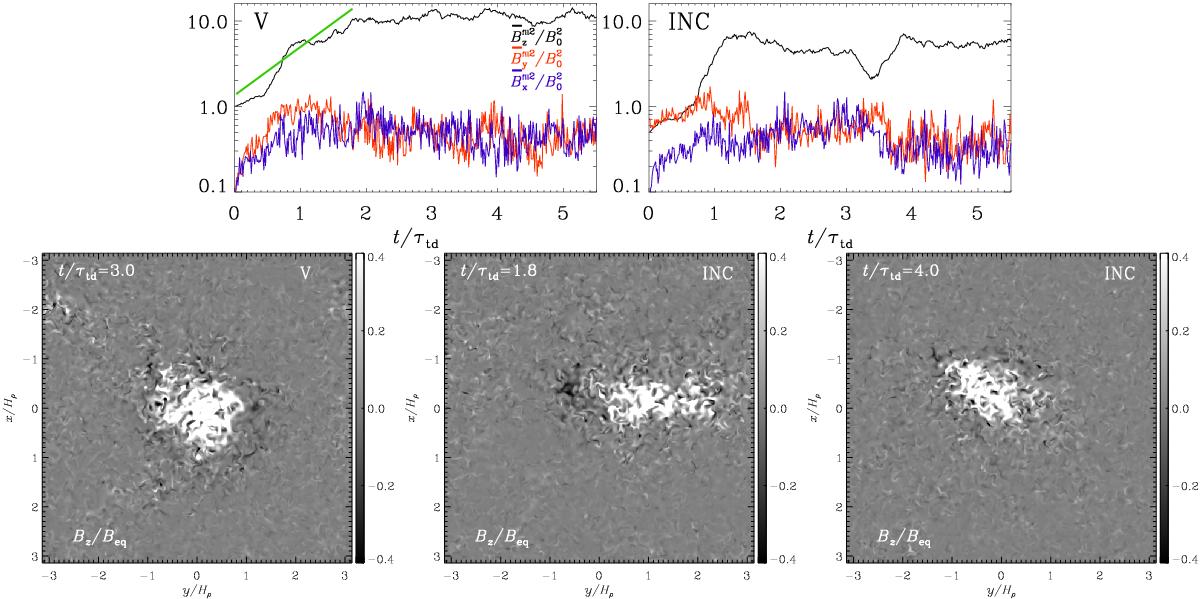
Formation of bipolar regions for two different field inclinations, left-hand side with purely vertical field (Run V) and right-hand side with y-z inclination (Run INC). Top row: the same as in Fig. 2, but for Runs V and INC. The straight green line for Run V illustrates the exponential growth of the energy in the vertical large-scale magnetic field. Bottom row: normalized vertical magnetic field Bz/Beq plotted at the xy surface (z = 0) at times when the bipolar regions are the clearest. Run INC is shown for an early time (t/τtd = 1.8) and a later time (t/τtd = 4.0) to illustrate the change from a bipolar to monopolar structure.
Current usage metrics show cumulative count of Article Views (full-text article views including HTML views, PDF and ePub downloads, according to the available data) and Abstracts Views on Vision4Press platform.
Data correspond to usage on the plateform after 2015. The current usage metrics is available 48-96 hours after online publication and is updated daily on week days.
Initial download of the metrics may take a while.