Fig. 1
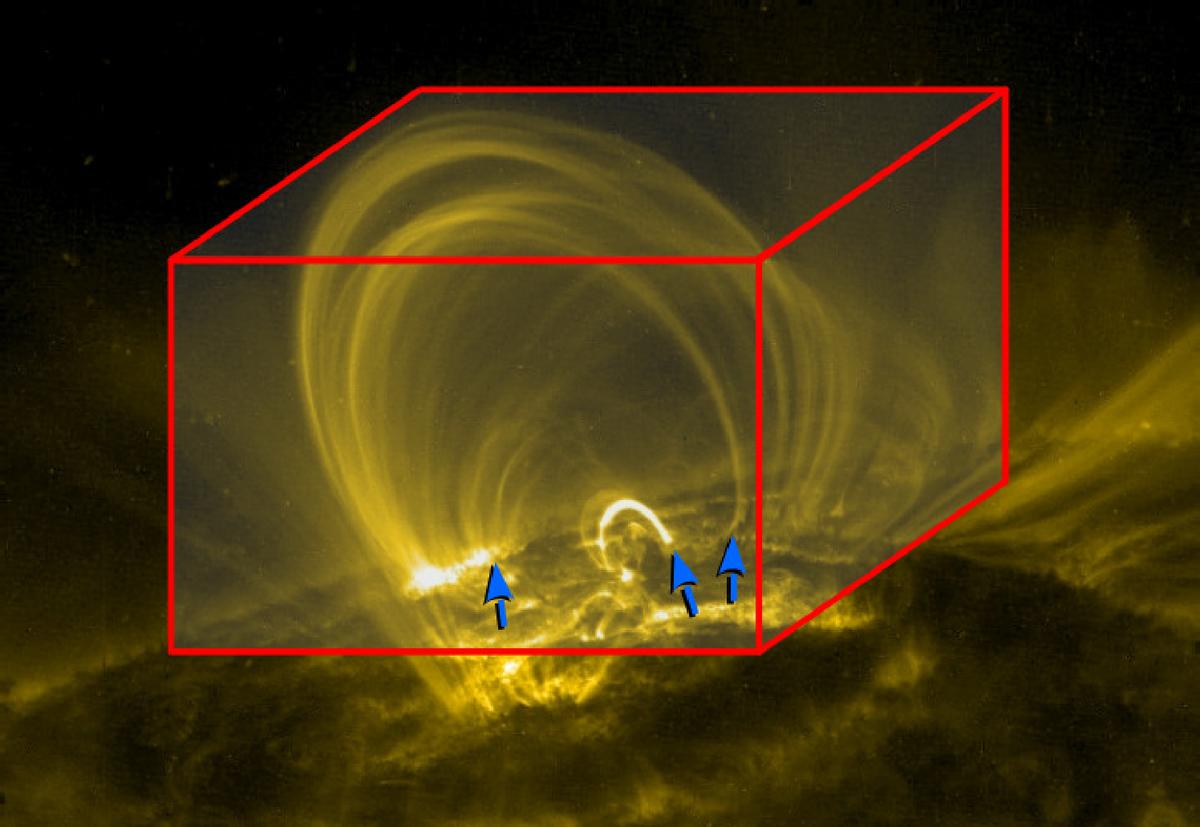
EUV emission of coronal loops above an active region (AR) observed by the TRACE satellite (Strong et al. 1994). The footpoints of short, intermediate, and longer loops of varying curvature and intensity are indicated by blue arrows. Typically, the short and most emissive loop is located in the core of an AR, while the longer loops may reach higher into the corona and may also connect to the periphery of the region. The spatial extent of our 3D MHD model is 235 × 235 × 156 Mm3 and is roughly indicated by the red box. Image credit: NASA/LMSAL.
Current usage metrics show cumulative count of Article Views (full-text article views including HTML views, PDF and ePub downloads, according to the available data) and Abstracts Views on Vision4Press platform.
Data correspond to usage on the plateform after 2015. The current usage metrics is available 48-96 hours after online publication and is updated daily on week days.
Initial download of the metrics may take a while.