Fig. 8
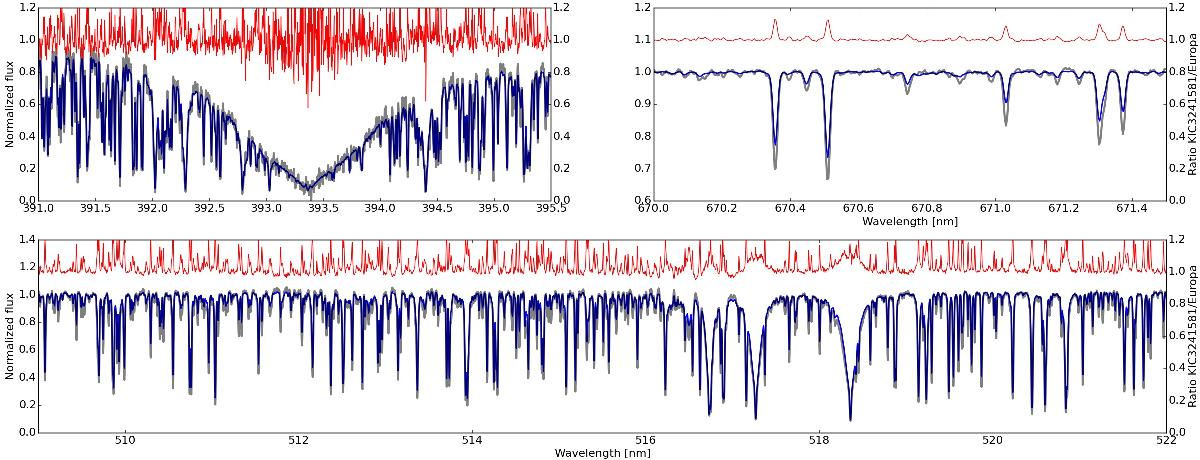
Direct comparison of the spectra of the solar analogue KIC 3241581 (grey line) through the spectrum of Europa (blue). The value of the spectrum, normalised to the pseudocontinuum is given on the left y-axis. The red curve on top of the two spectra depicts the ratio between the flux per bin of KIC 3241581 and Vesta (right y-axis). The Ca K line, and the lithium doublet at 670.8 nm are shown in the left, and right panels, respectively, while the Mg triplet is depicted in the bottom panel.
Current usage metrics show cumulative count of Article Views (full-text article views including HTML views, PDF and ePub downloads, according to the available data) and Abstracts Views on Vision4Press platform.
Data correspond to usage on the plateform after 2015. The current usage metrics is available 48-96 hours after online publication and is updated daily on week days.
Initial download of the metrics may take a while.