Fig. 6
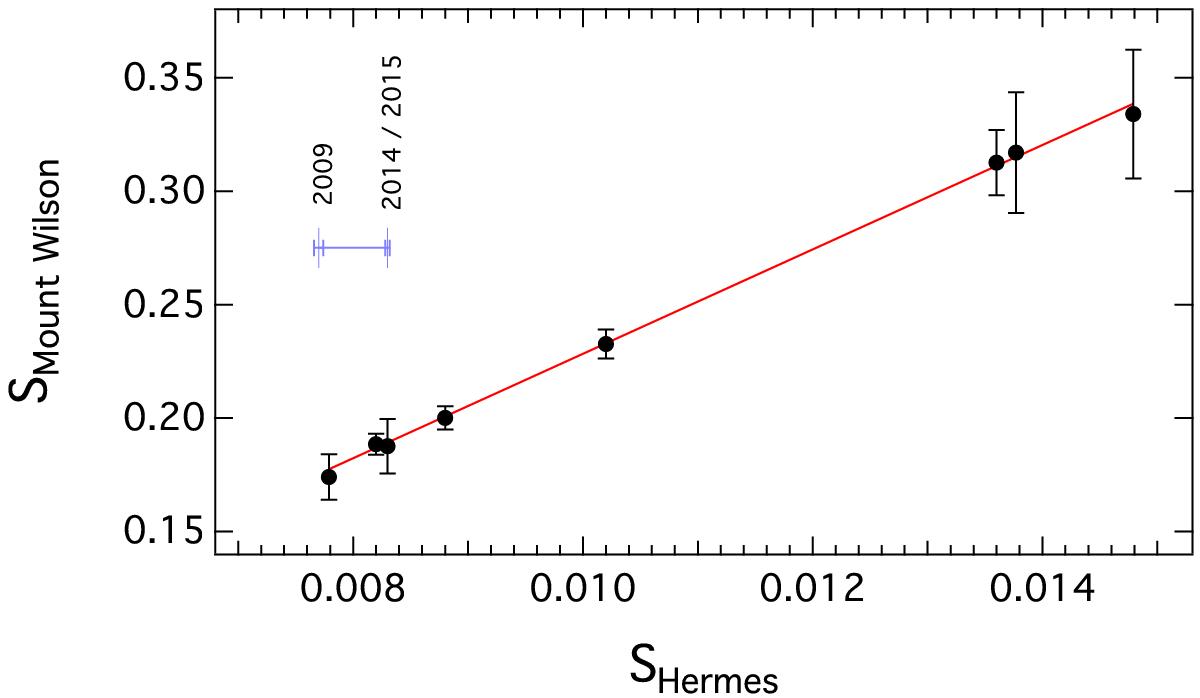
Calibration of the ![]() -index by comparing the measured
-index by comparing the measured ![]() -index from HERMES with the average tabulated value from MWO-observations (cf. Table 6). For multiple observations, the vertical error bars reflect the scatter of those stars in the MWO catalogue, otherwise, the reported uncertainty was adopted. The red line depicts the linear correlation. For comparison, the instrumental
-index from HERMES with the average tabulated value from MWO-observations (cf. Table 6). For multiple observations, the vertical error bars reflect the scatter of those stars in the MWO catalogue, otherwise, the reported uncertainty was adopted. The red line depicts the linear correlation. For comparison, the instrumental ![]() -value of the Sun, measured in minimum phase of cycle 23 in August 2009 and in maximum phase of cycle 24 April 2015, on the horizontal axis is shown, reflecting the variation . The scatter of
-value of the Sun, measured in minimum phase of cycle 23 in August 2009 and in maximum phase of cycle 24 April 2015, on the horizontal axis is shown, reflecting the variation . The scatter of ![]() within the time series of our observations of Europa is shown with the blue symbol in the upper left part of the diagram.
within the time series of our observations of Europa is shown with the blue symbol in the upper left part of the diagram.
Current usage metrics show cumulative count of Article Views (full-text article views including HTML views, PDF and ePub downloads, according to the available data) and Abstracts Views on Vision4Press platform.
Data correspond to usage on the plateform after 2015. The current usage metrics is available 48-96 hours after online publication and is updated daily on week days.
Initial download of the metrics may take a while.