Fig. 3
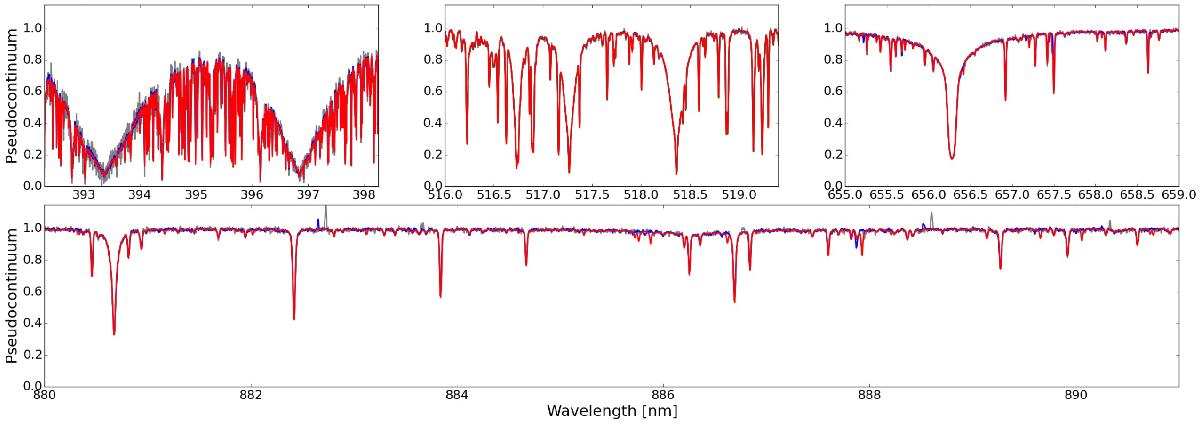
Comparison of the HERMES spectra (blue and grey lines) with the smoothed Kurucz spectrum (red line) around the Ca H&K lines (top left panel), the Mg-triplet (top centre panel) and the Hα line (top right panel). The bottom panel shows the region in the infrared around the Paschen line at 887 nm. The differences between the three spectra around Hα and the Paschen line originate from the contamination casued by telluric lines. In the infrared, several weak telluric emission lines are also seen.
Current usage metrics show cumulative count of Article Views (full-text article views including HTML views, PDF and ePub downloads, according to the available data) and Abstracts Views on Vision4Press platform.
Data correspond to usage on the plateform after 2015. The current usage metrics is available 48-96 hours after online publication and is updated daily on week days.
Initial download of the metrics may take a while.