Fig. 1
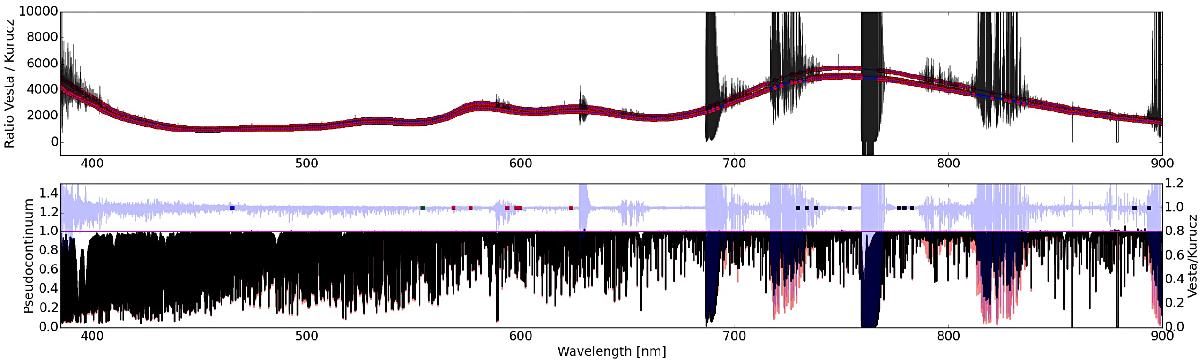
Normalisation and compilation of the solar spectrum from observations of Vesta. The top panel shows the result of the division of the HERMES spectra by the Kurucz solar atlas for each individual exposure. Red dots indicate the supporting points for the cubic spline, depicted as a blue line. The regions of large deviations from the fit originate from contamination through telluric lines. The bottom panel depicts the resulting median spectrum obtained for the Vesta observations (in black) and the Kurucz (2005) spectrum (in red). The ratio between the spectra from Vesta and Kurucz are depicted as the blue line on the right hand y-axis. The regions used to determine the S/N in Strömgren b, and y as well as Johnson R and I, are indicated in the bottom panel as blue, green, red, and black dots, respectively.
Current usage metrics show cumulative count of Article Views (full-text article views including HTML views, PDF and ePub downloads, according to the available data) and Abstracts Views on Vision4Press platform.
Data correspond to usage on the plateform after 2015. The current usage metrics is available 48-96 hours after online publication and is updated daily on week days.
Initial download of the metrics may take a while.