Free Access
Fig. A.4
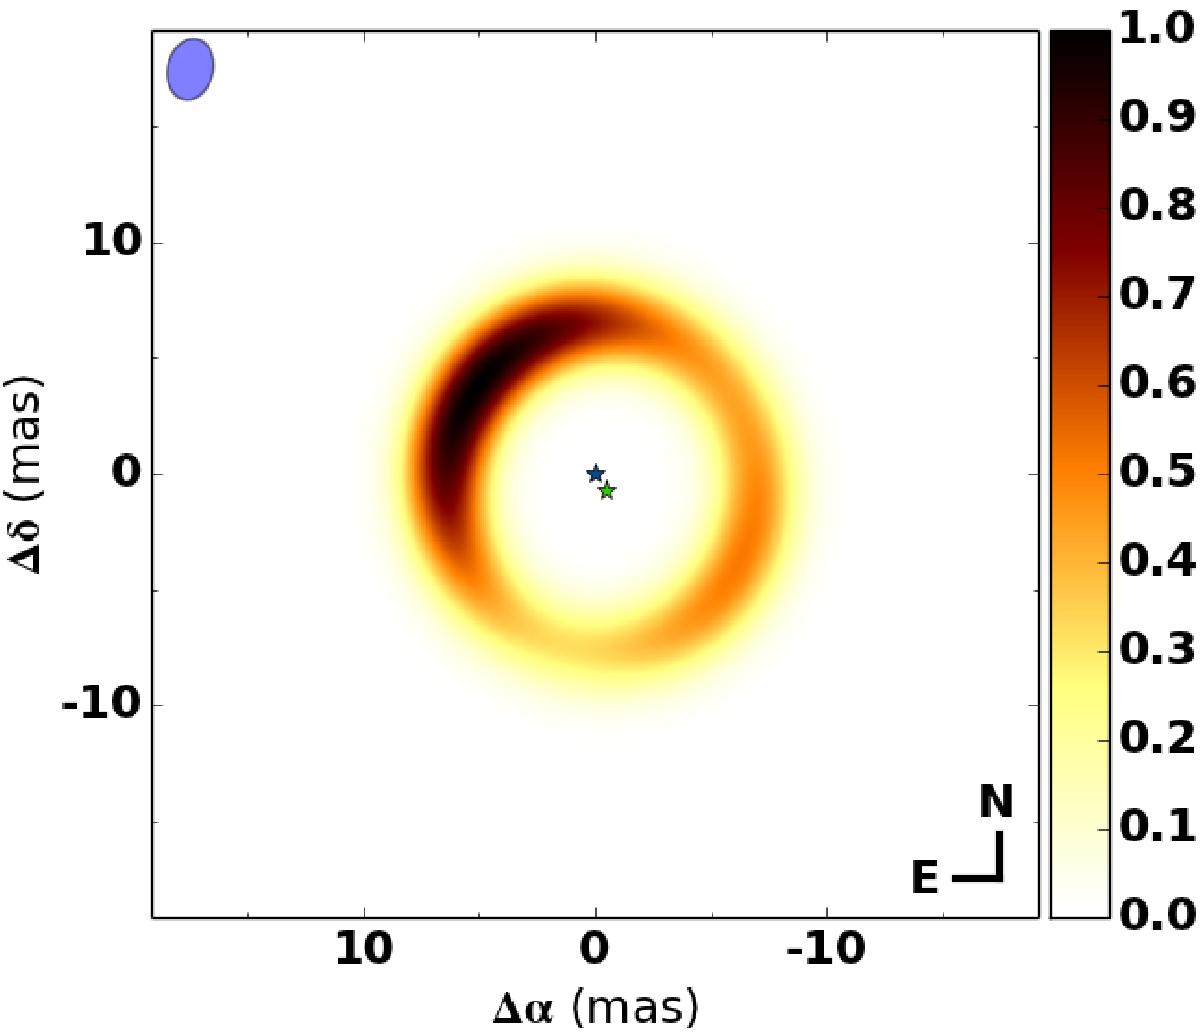
Theoretical brightness distribution of our best-fit parametric model. The color bar shows normalized flux, scaled to the highest pixel value in the image. The position of the primary and secondary star are indicated with a blue and green star symbol, respectively.
Current usage metrics show cumulative count of Article Views (full-text article views including HTML views, PDF and ePub downloads, according to the available data) and Abstracts Views on Vision4Press platform.
Data correspond to usage on the plateform after 2015. The current usage metrics is available 48-96 hours after online publication and is updated daily on week days.
Initial download of the metrics may take a while.