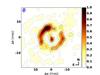
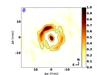
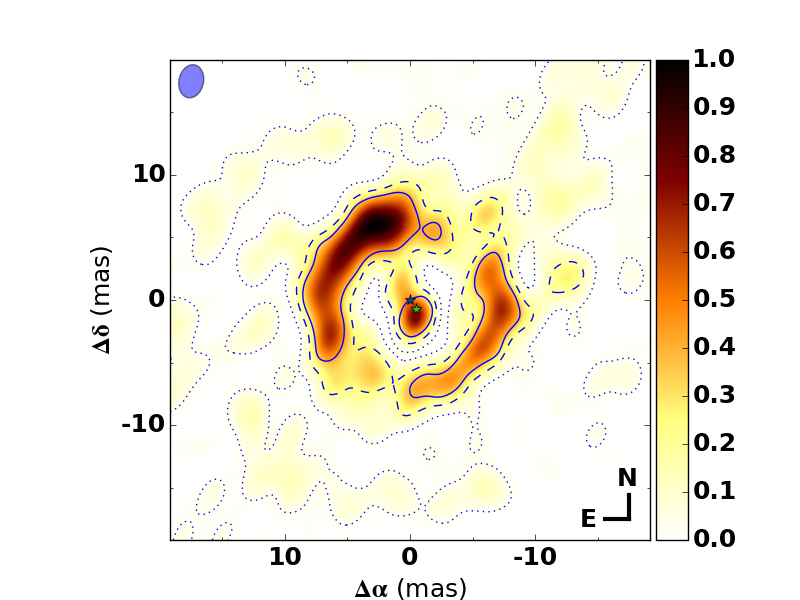
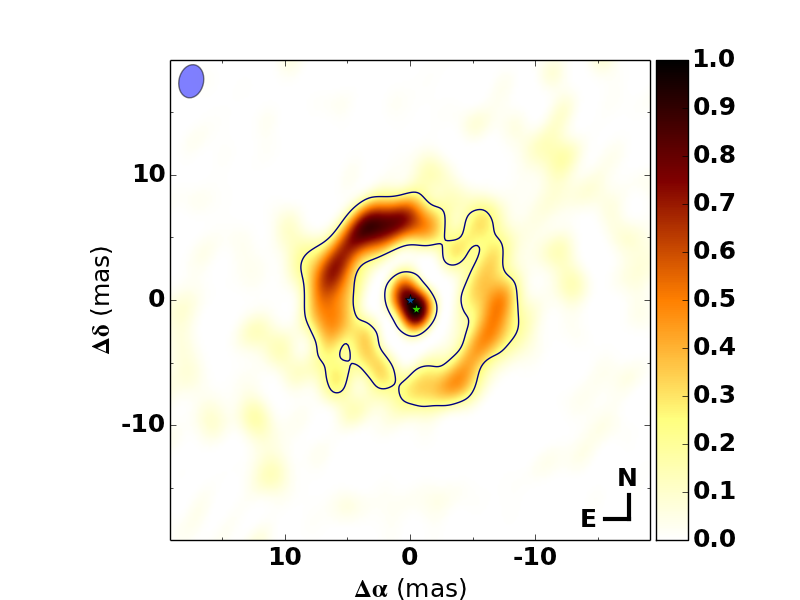
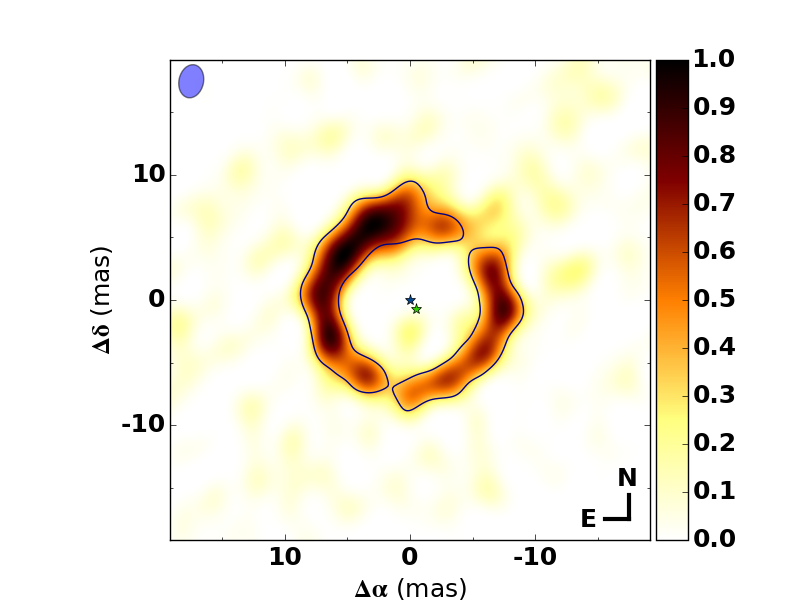
Fig. 2
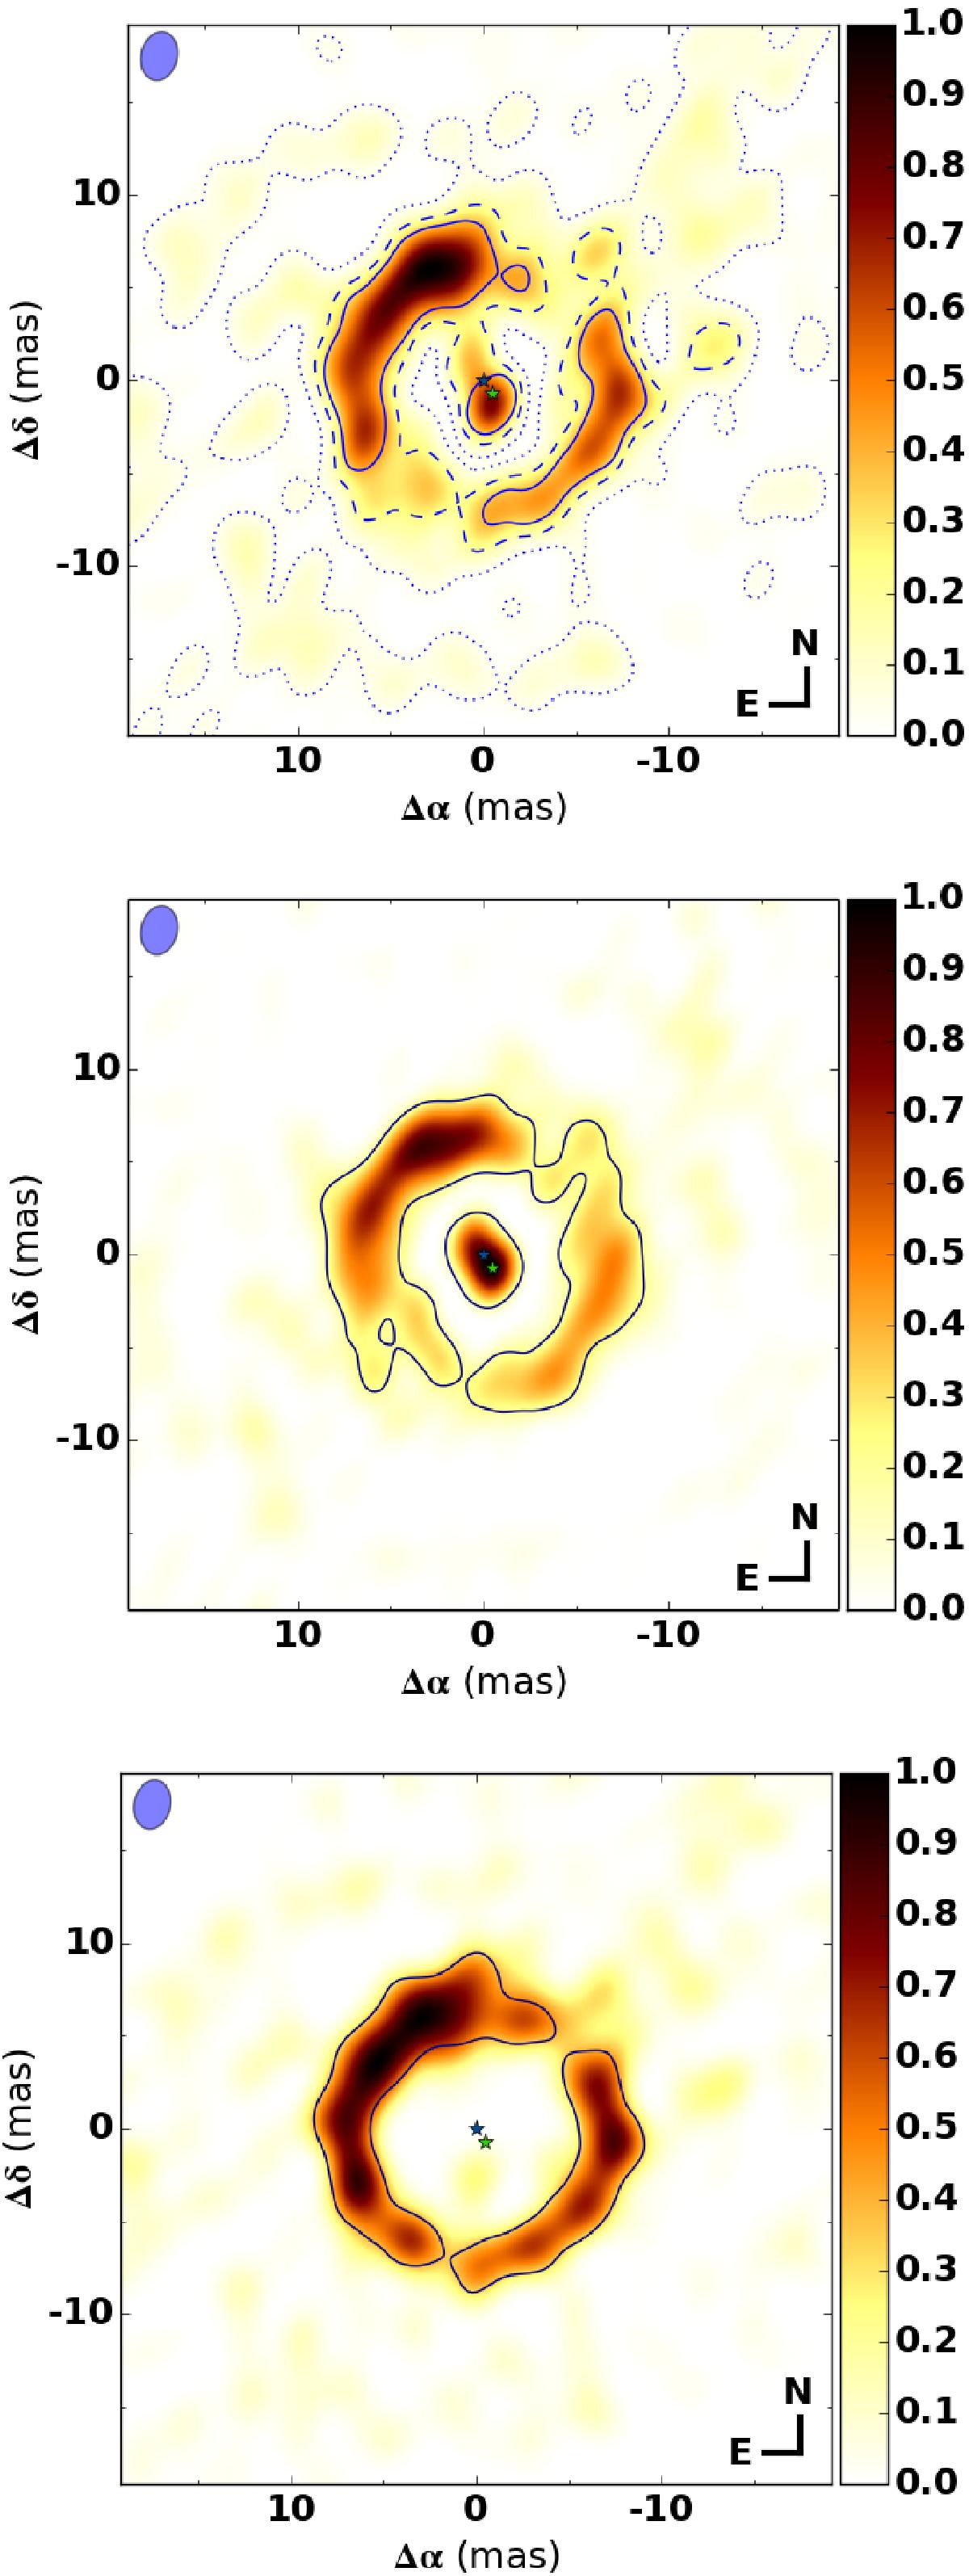
Reconstructed images. Upper panel: single-star-subtracted reconstruction of the original data. Middle panel: single-star-subtracted construction of the synthetic data set made with the best-fit parametric model. Lower panel: binary-subtracted reconstruction of the original data. The horizontal and vertical axes contain right ascension and declination coordinates in units of milli-arcseconds, respectively (the north and east directions are indicated in the lower right corner). The blue ellipse shows the beamsize. The full, dashed and dotted lines delineate pixels that have fluxes above 5, 3 and 1σ, respectively. For clarity only the 5σ contours are shown in the lower panels. The blue and green star symbols indicate the positions of the two stars as determined from the best-fit parametric model (the actual flux of the primary is subtracted from the image). The color indicates normalized flux, scaled to the highest pixel value in the image.
Current usage metrics show cumulative count of Article Views (full-text article views including HTML views, PDF and ePub downloads, according to the available data) and Abstracts Views on Vision4Press platform.
Data correspond to usage on the plateform after 2015. The current usage metrics is available 48-96 hours after online publication and is updated daily on week days.
Initial download of the metrics may take a while.