Fig. 2
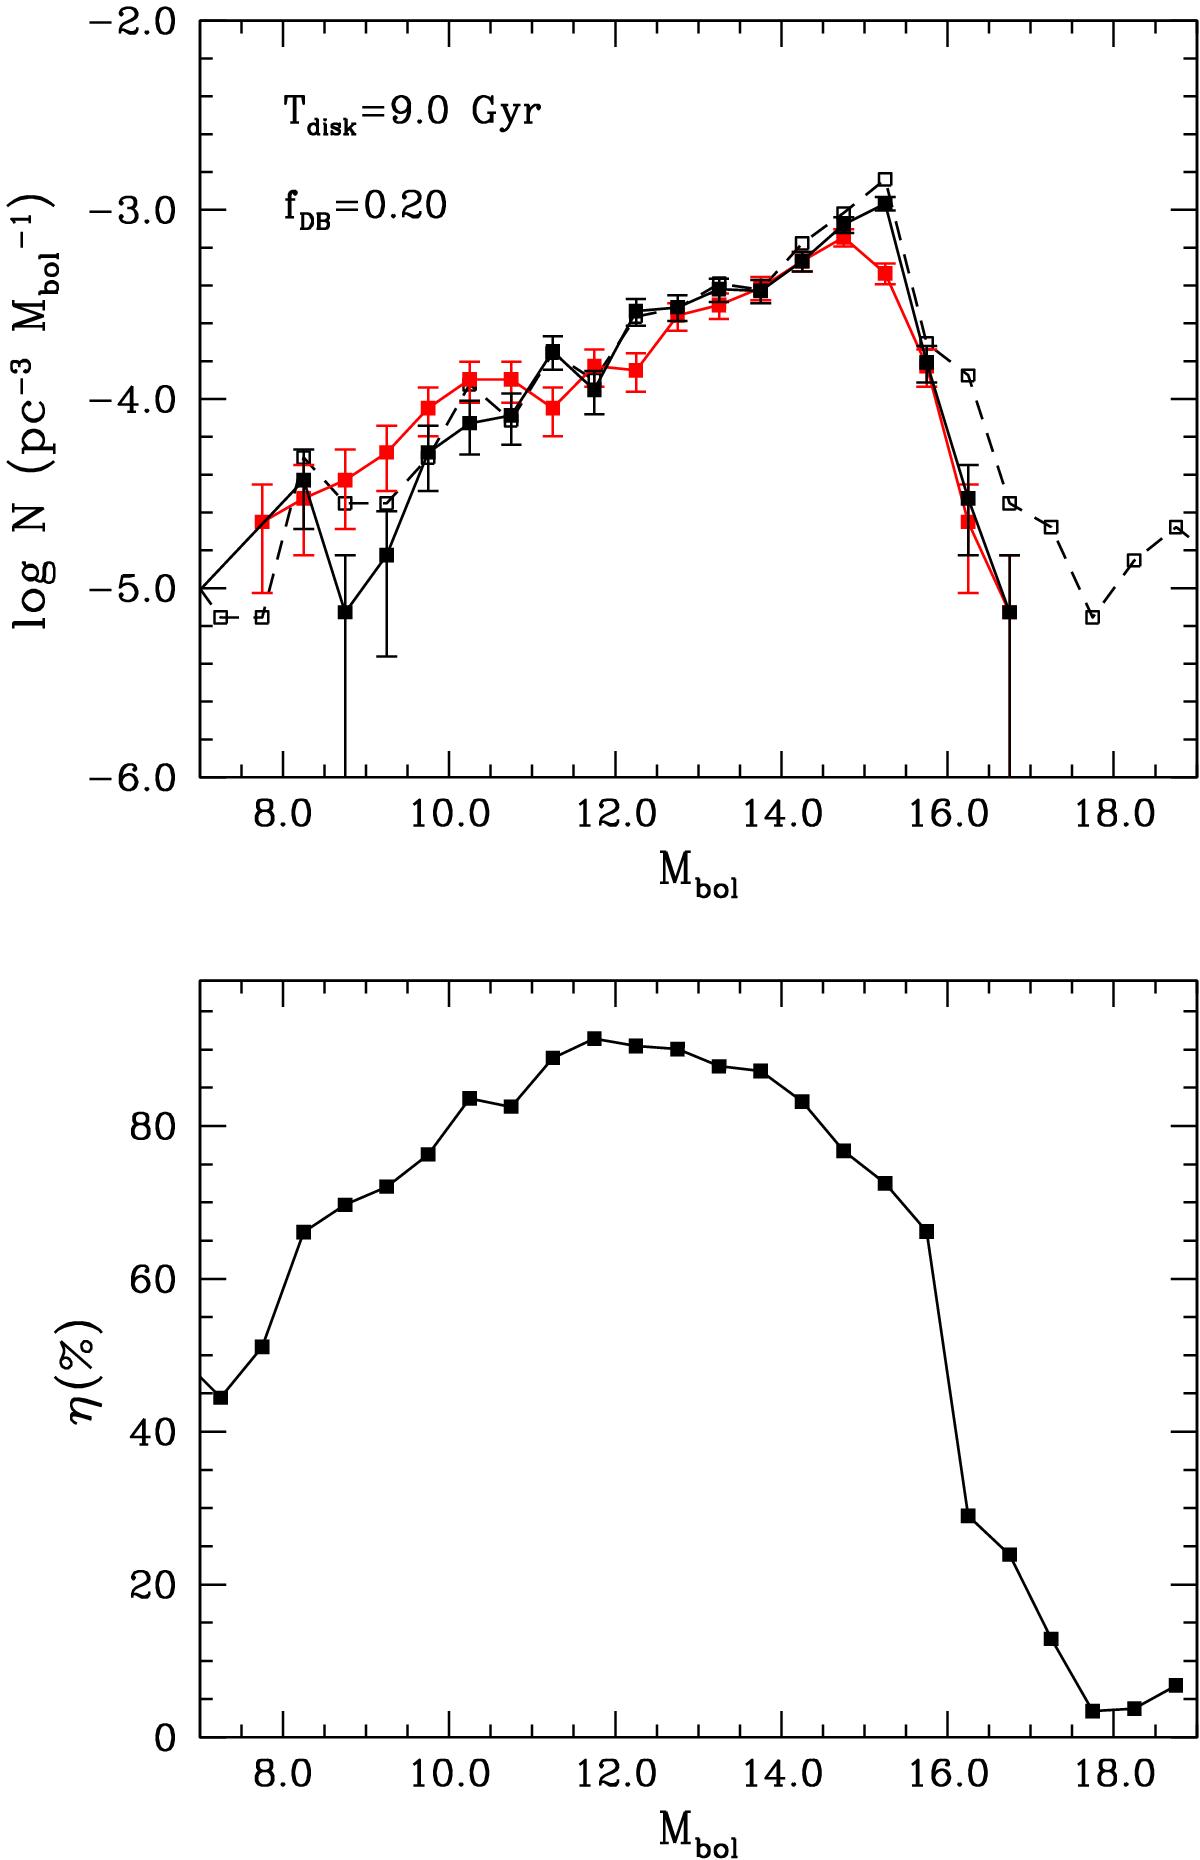
Top panel: synthetic white dwarf luminosity functions (black lines) compared to the observed luminosity function (red line). The solid line shows the luminosity function of the simulated white dwarf population when all the selection criteria have been considered, while the dashed line displays the luminosity function of the entire sample. Bottom panel: completeness of white dwarf population for our reference model.
Current usage metrics show cumulative count of Article Views (full-text article views including HTML views, PDF and ePub downloads, according to the available data) and Abstracts Views on Vision4Press platform.
Data correspond to usage on the plateform after 2015. The current usage metrics is available 48-96 hours after online publication and is updated daily on week days.
Initial download of the metrics may take a while.